Processing history
The PNR processing history helps you see exactly what happened during each run – so you can investigate issues, validate system behavior, or just stay in control.
Why it matters
Processing history provides a log of all processes executed for a specific instance, enabling:
- Process optimization – review how conditions are evaluated and adjust step configuration to improve overall workflow performance
- Troubleshooting and debugging – identify which path a block followed and why, helping detect missing or misconfigured rules caused by unaccounted inputs
How it works
An object (PNR or document) can be processed by multiple schemes, each creating an individual instance. Each time a scheme runs, it sends a request to the GDS and starts a new session.
Since the data in the PNR may change between runs, the processing flow can differ – even when using the same scheme instance.
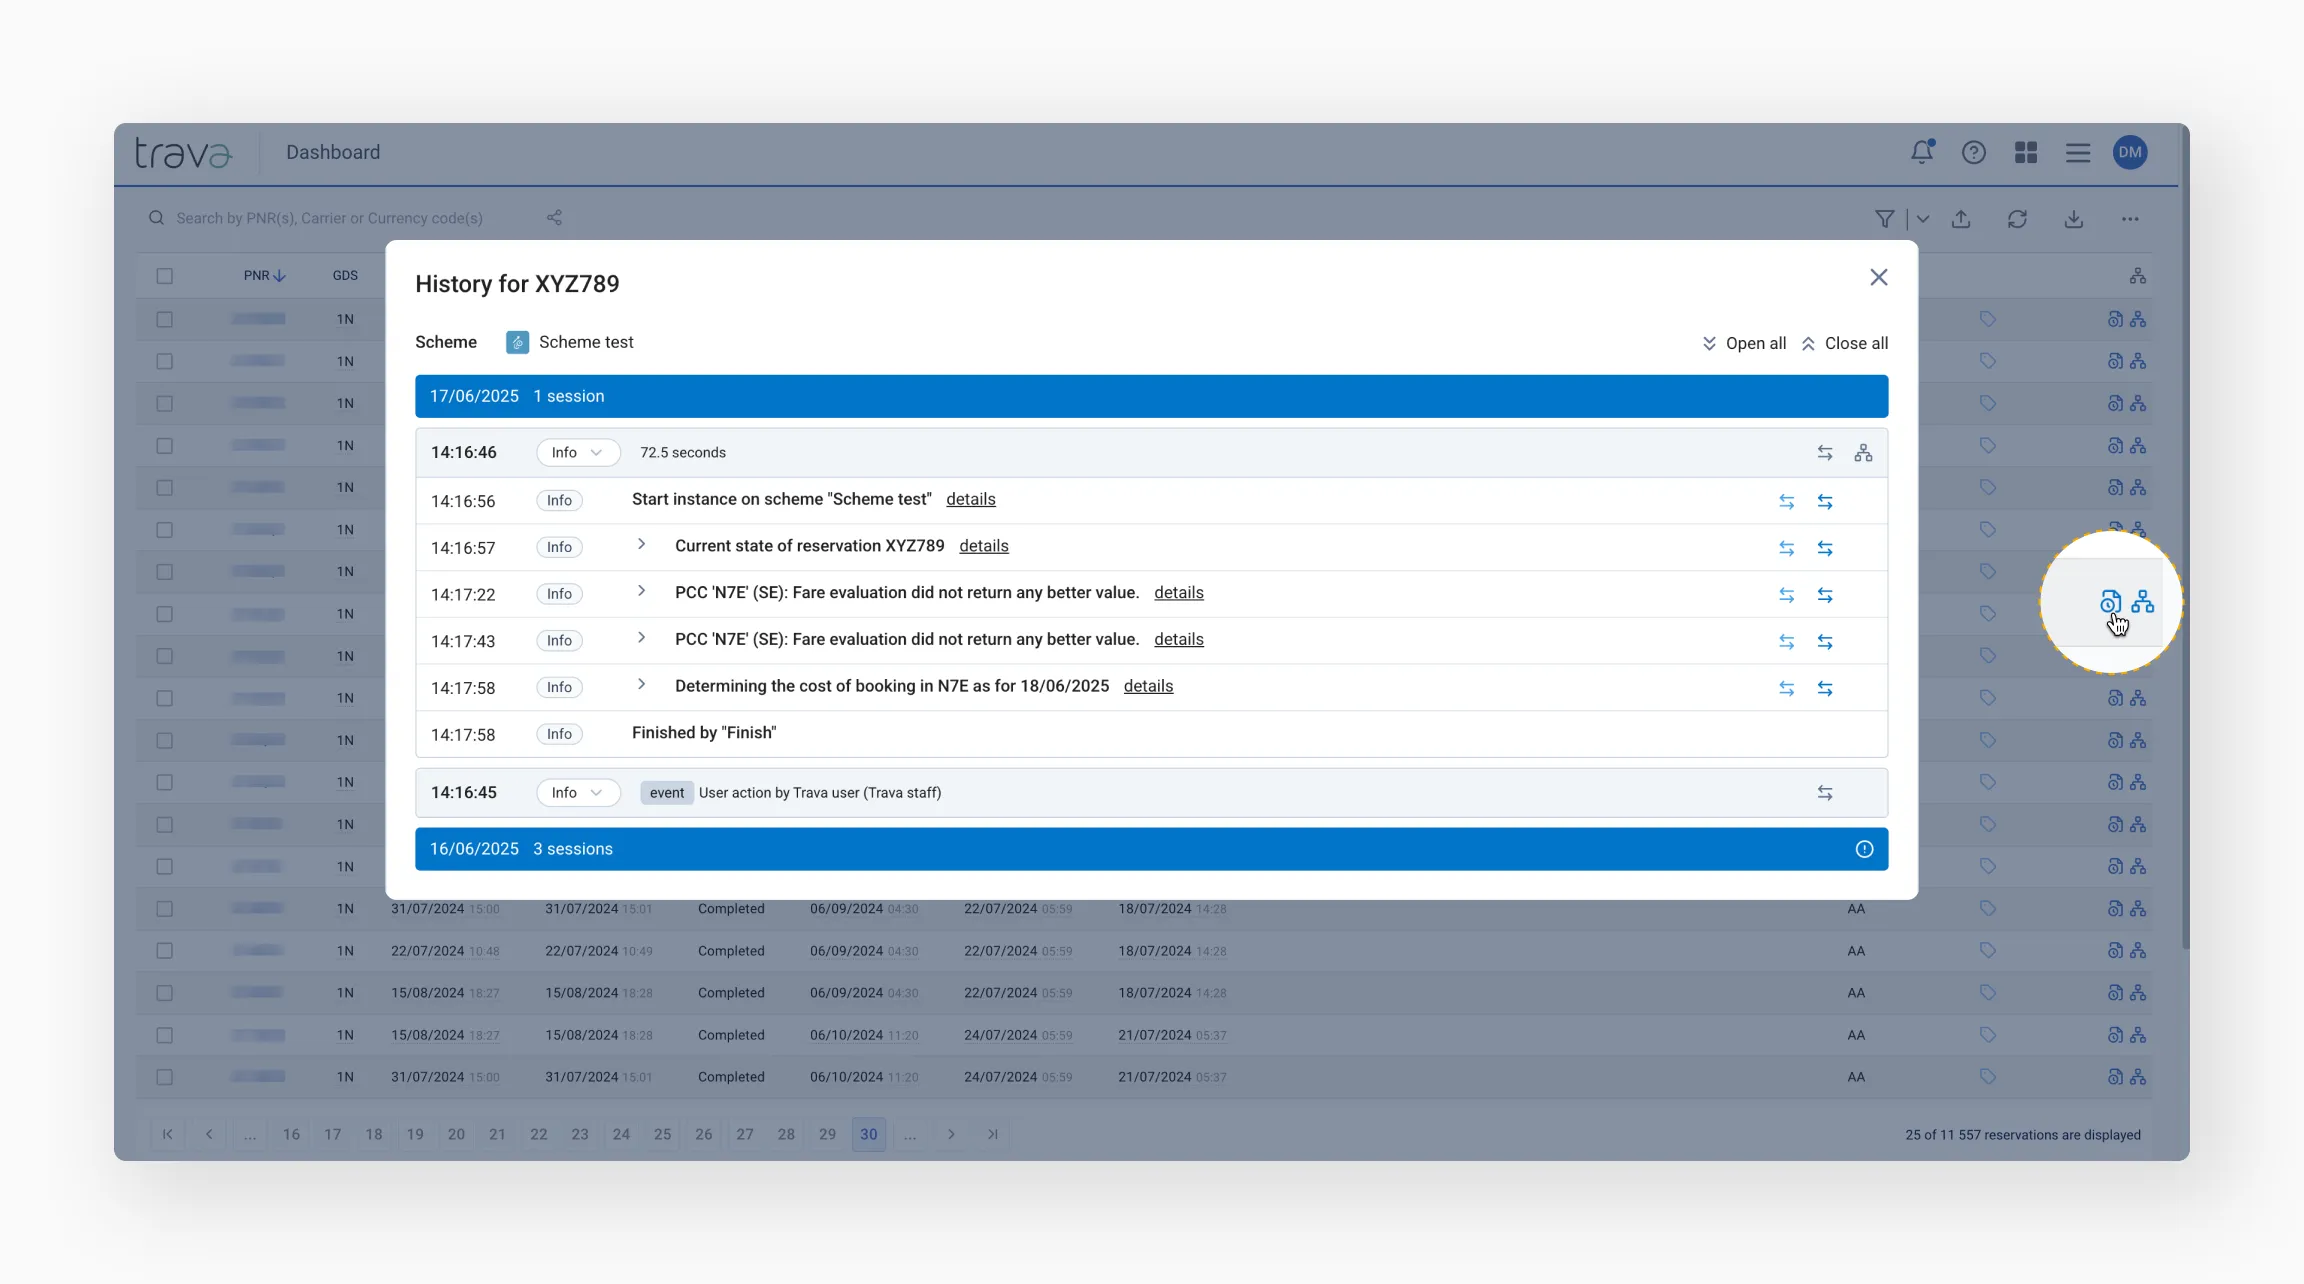
To open the processing history, click the icon at the end of the instance row on the Reservation Processing page.
Understanding processing history
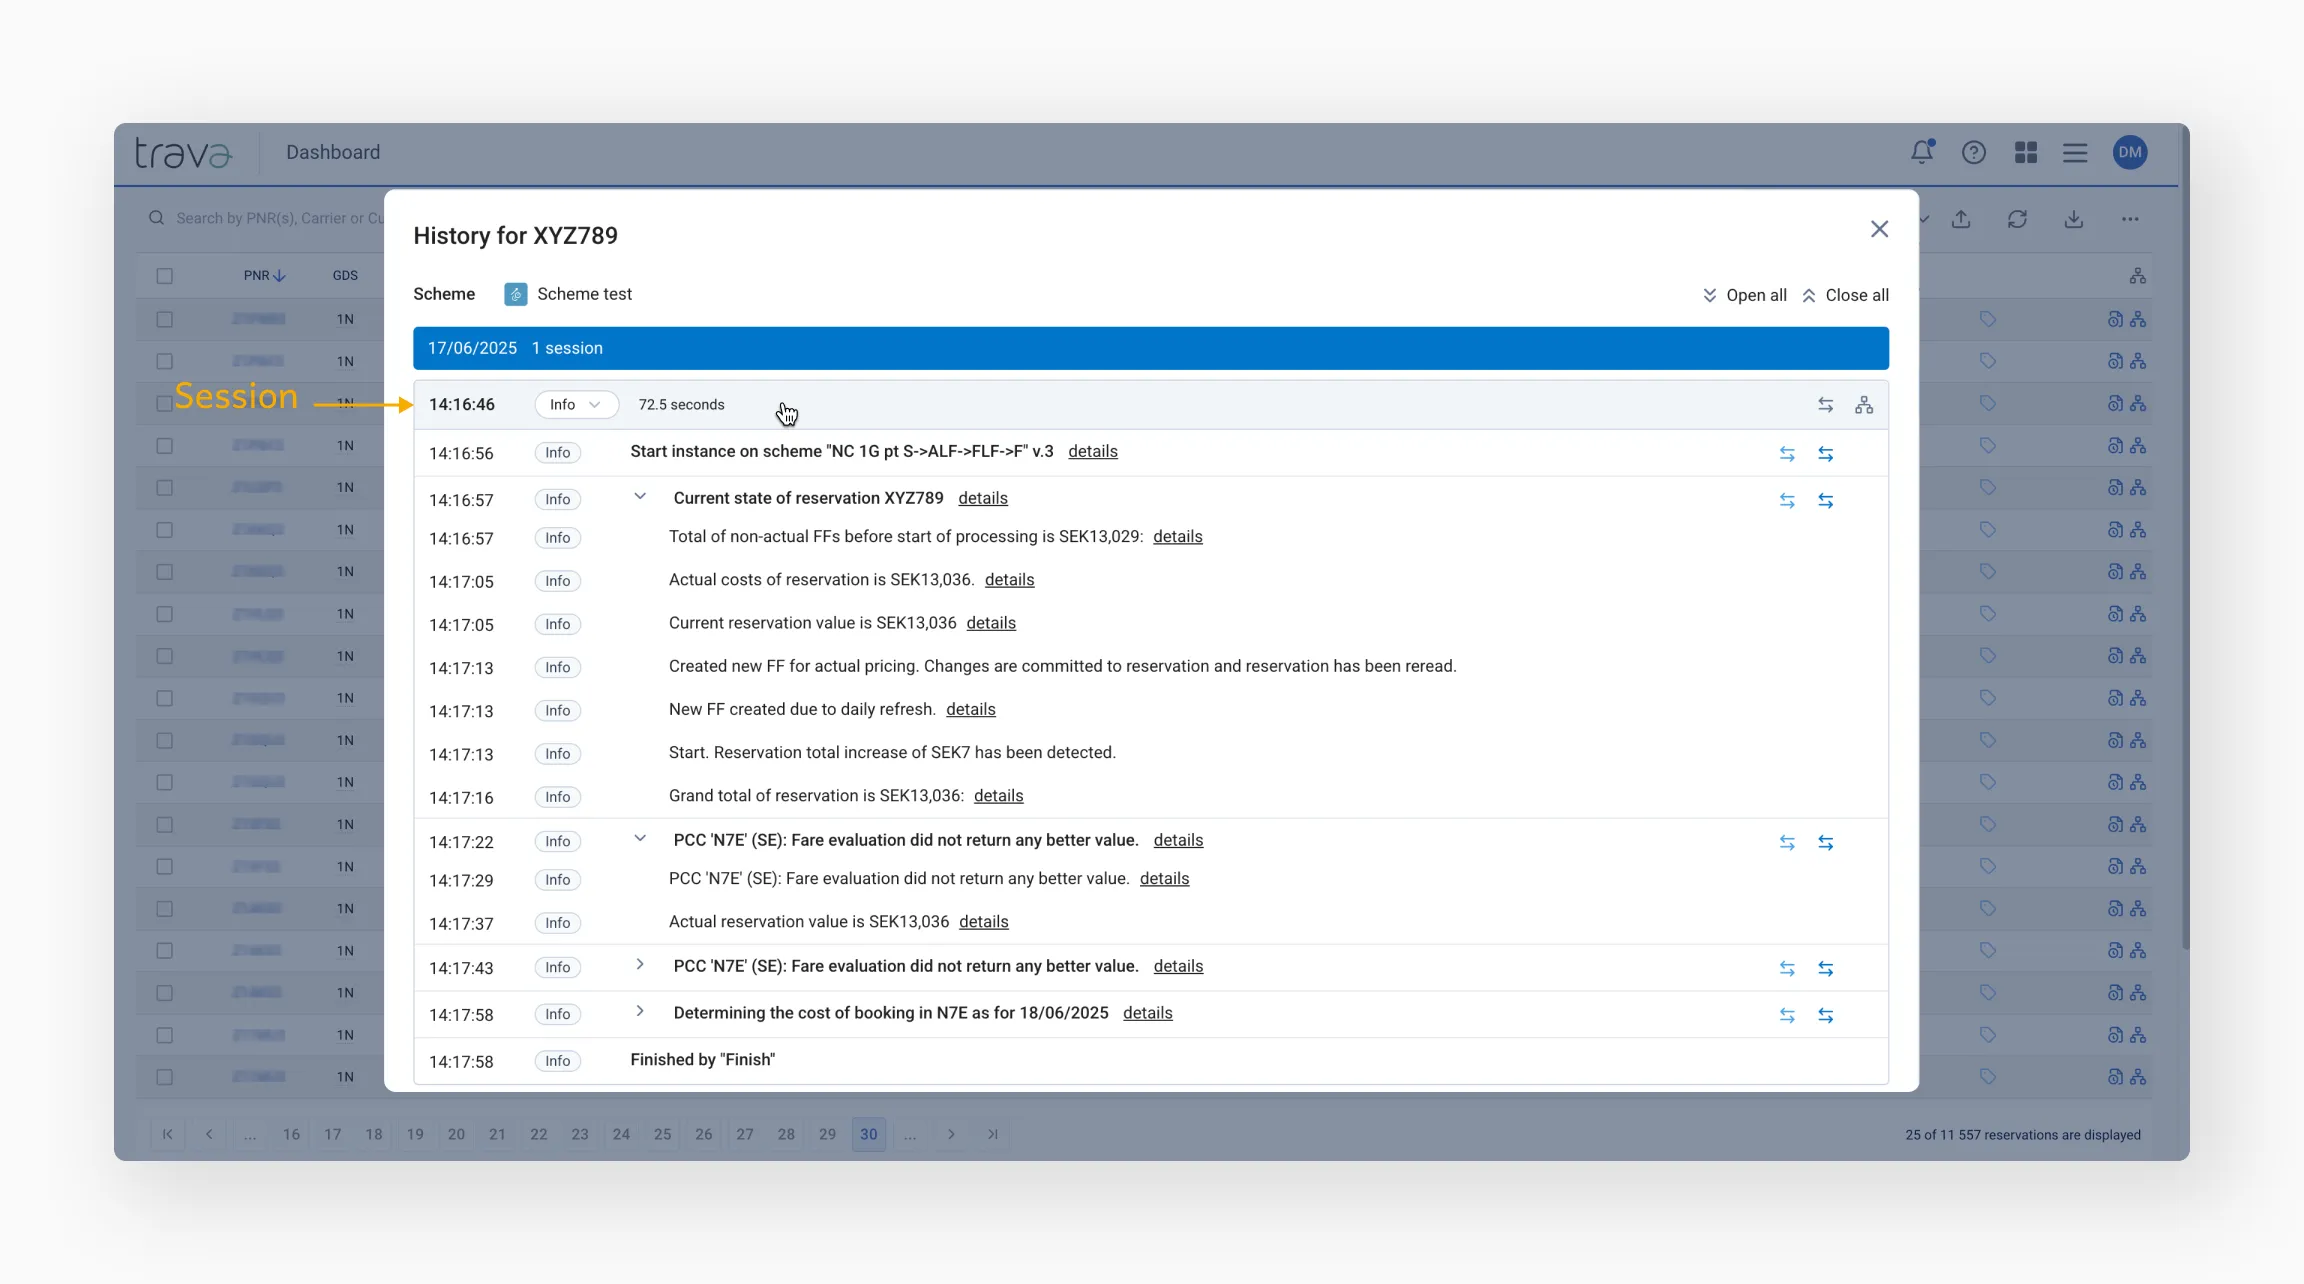
Sessions
Each run is saved as a session in the processing history. A session captures the state of the PNR or document at the time it was processed.
Sessions are displayed from bottom to top and grouped by date, making it easy to follow the sequence of processing attempts across longer histories.
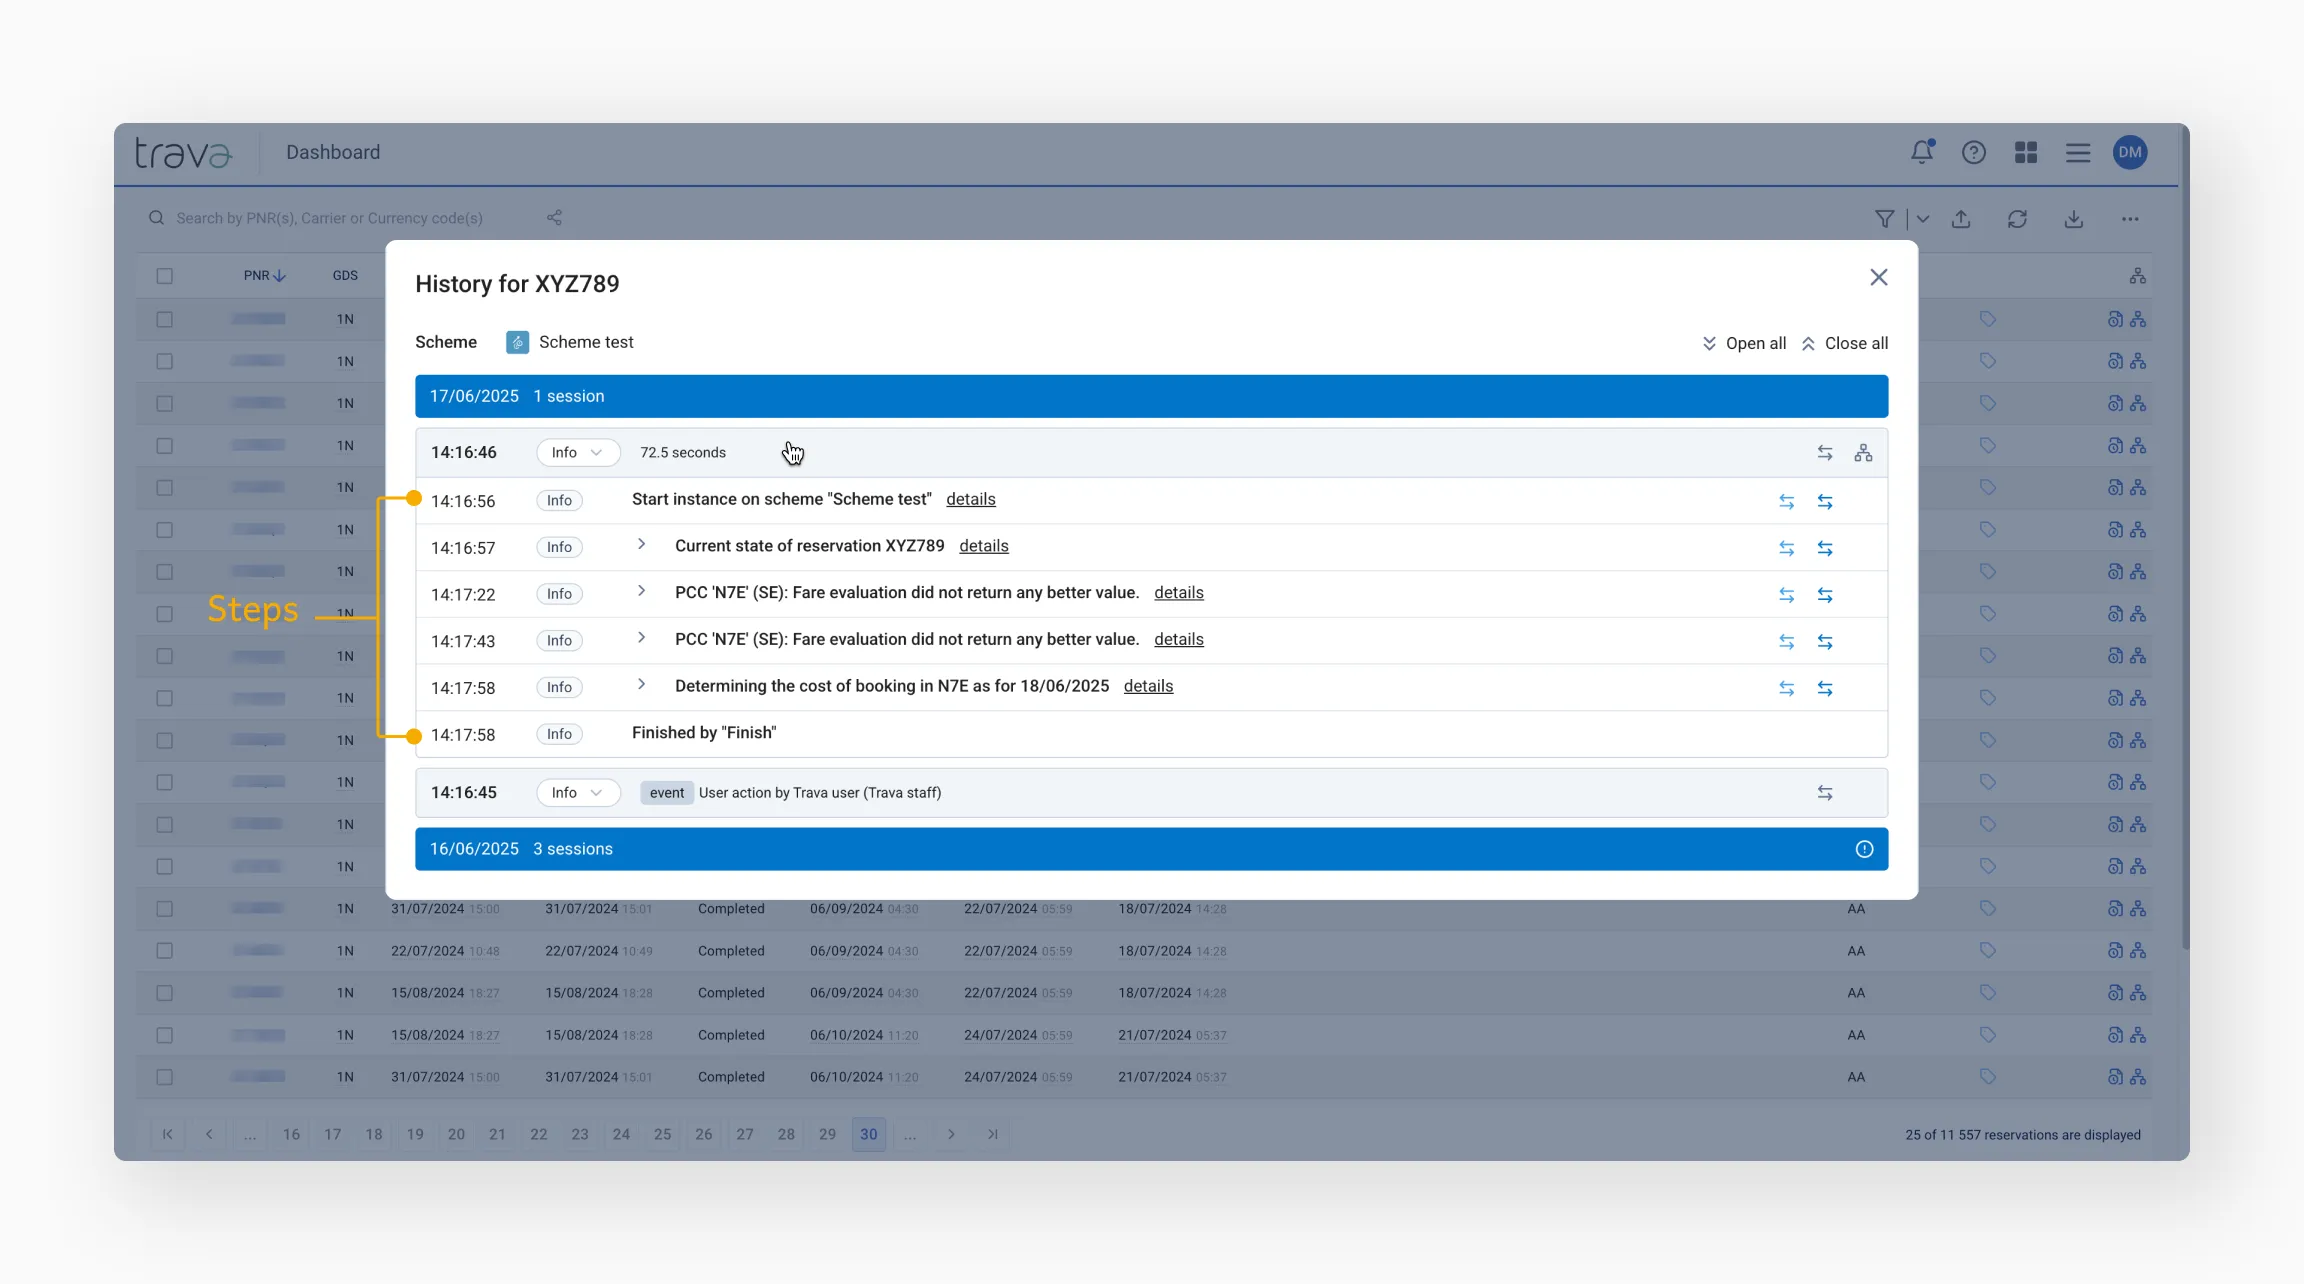
Sessions will continue as long as workflow conditions or design postpone processing. At the end of each session, you'll see when the next run is scheduled.
If no further runs are expected, the status will show Finish.
Steps
Sessions are made up of steps. They provide the details of how the session was processed. Click a session row to view details.
Events
Steps consist of processing events. Each event is assigned a number. Hover over the end of the step row – the dash icon will appear, showing the event number in a tooltip.
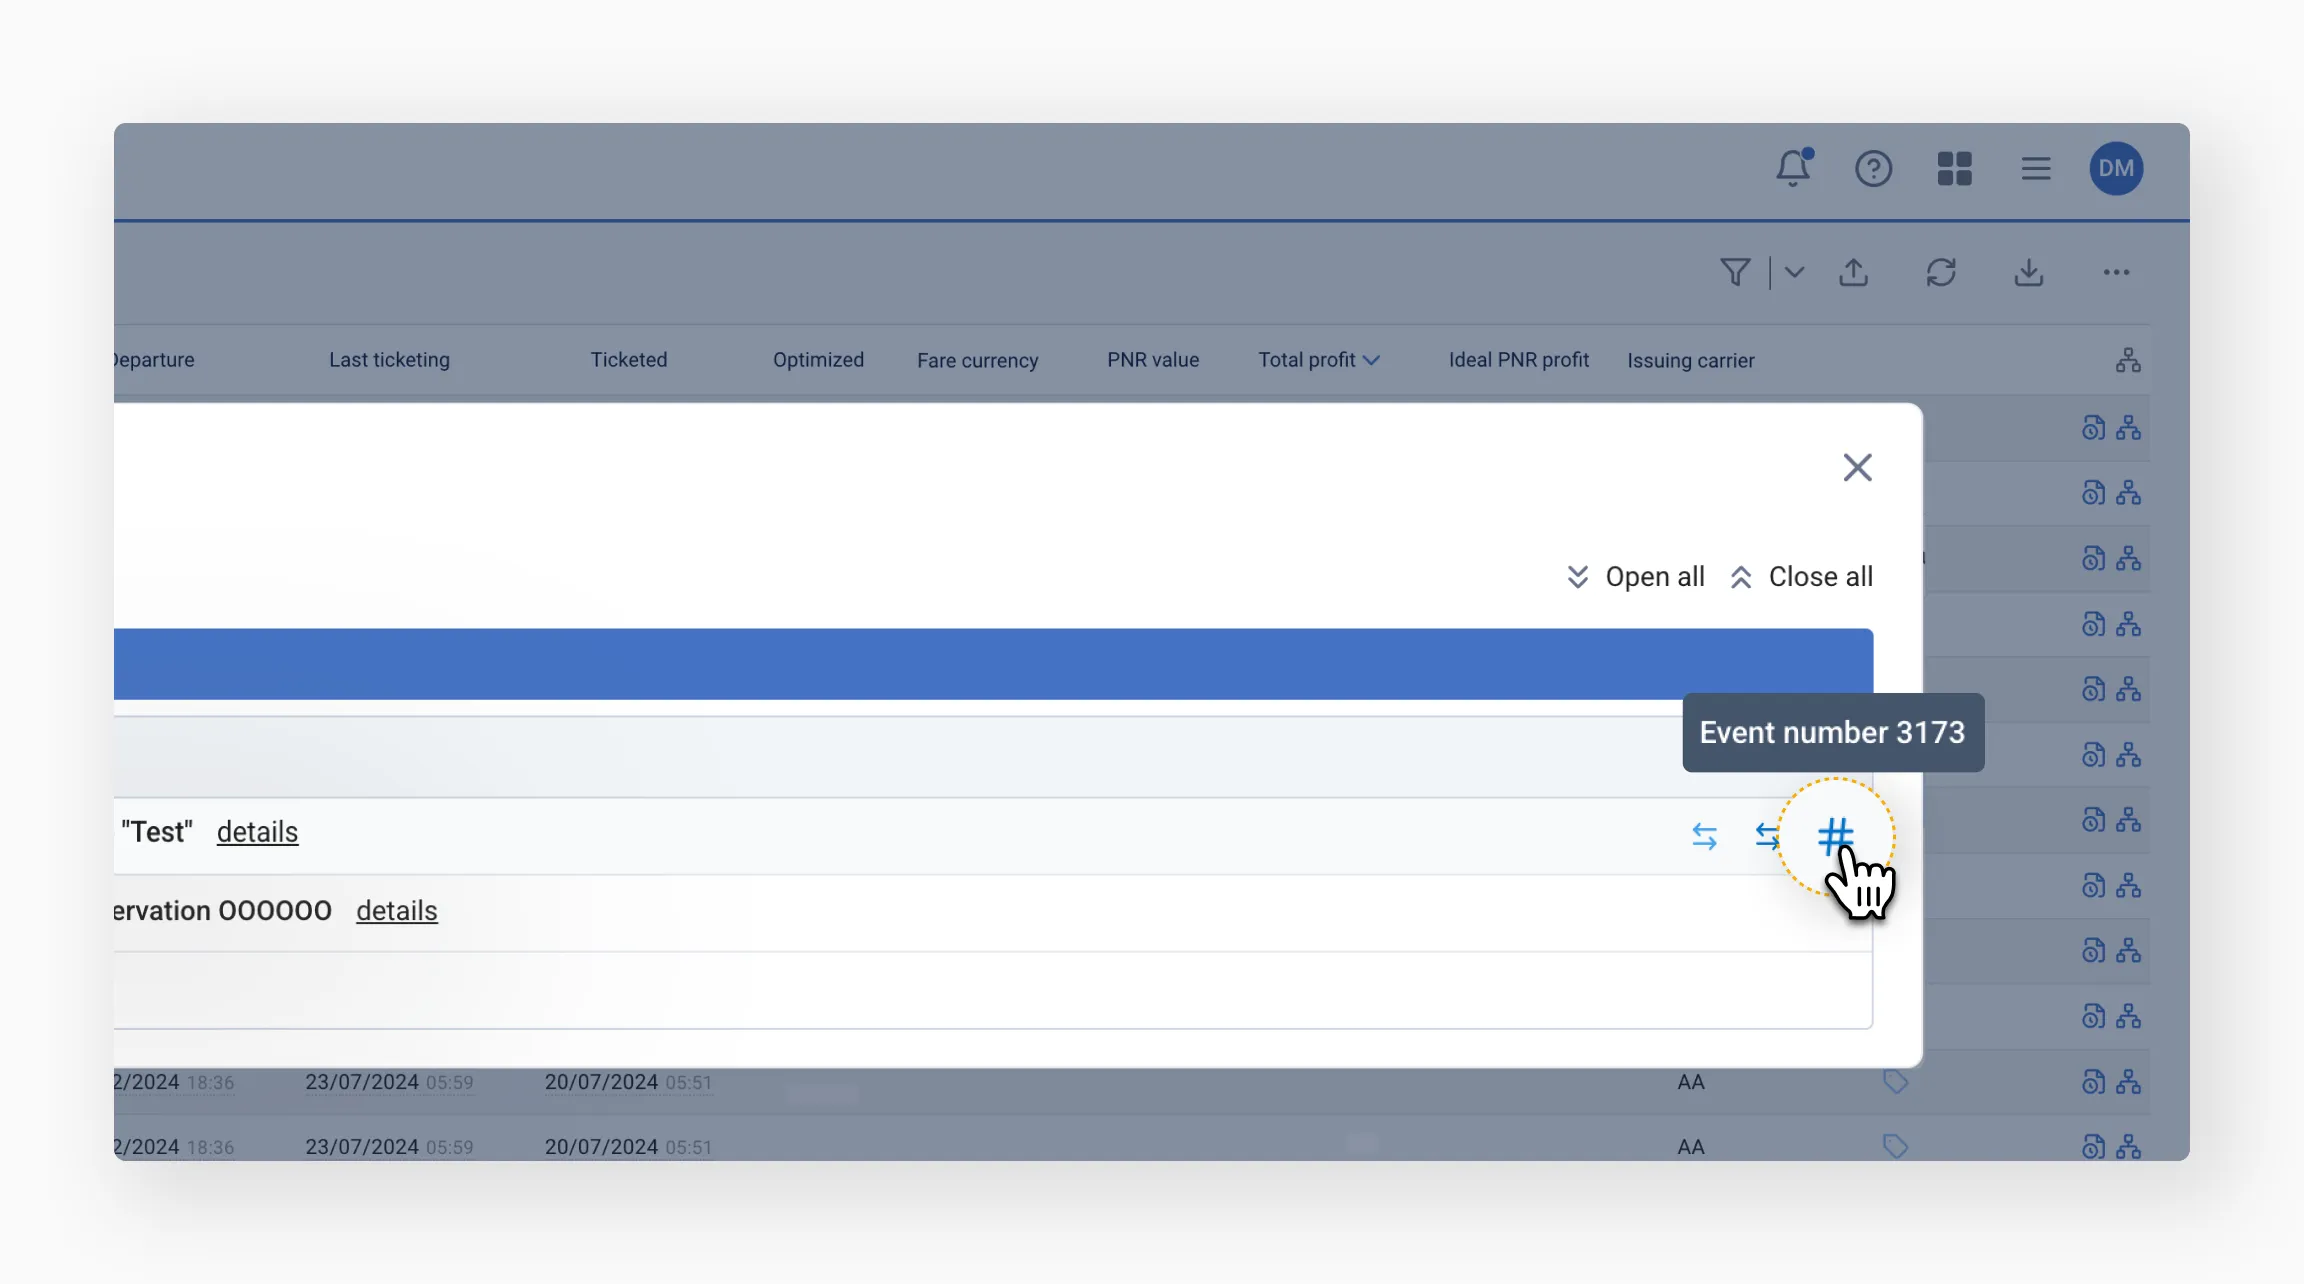
The event at the bottom shows the initial reason why the PNR was processed in this instance.
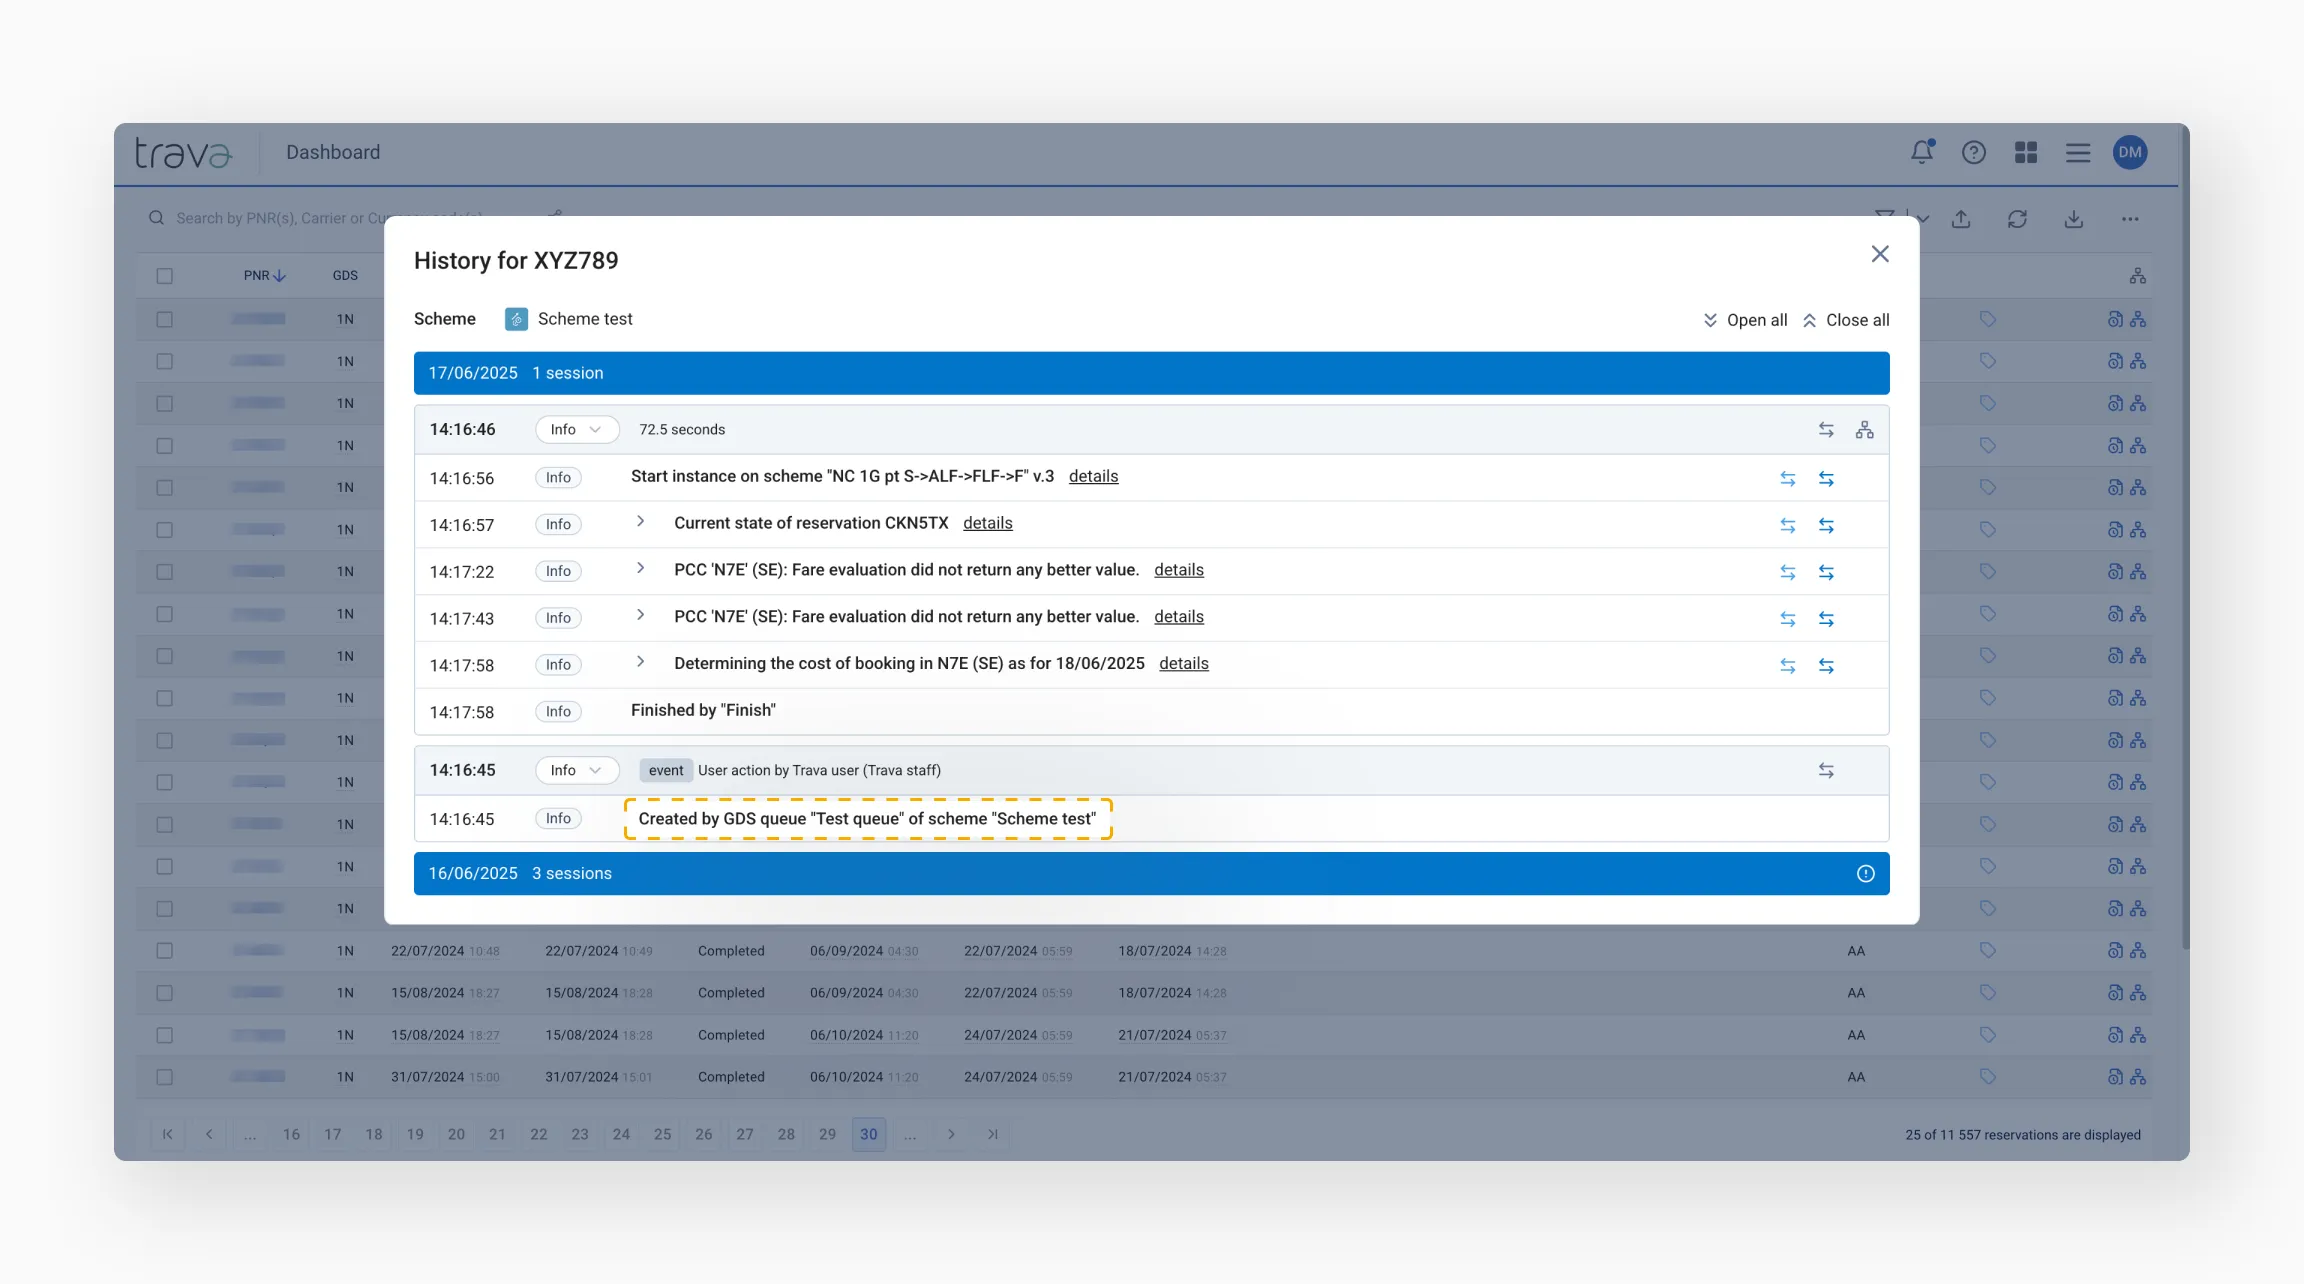
Common scenarios include:
- The PNR was received from a GDS queue
- The run was redirected to this scheme by another scheme
- The PNR was launched manually
You can also use the event number to search for specific instances.
Category levels
For a more detailed view, adjust the category level:
- Info (default) – shows only action blocks
- Trace – displays the full processing path, including how conditions were evaluated
- Debug – provides additional technical details
- Warning or Error – shows only steps that include warnings or errors

If you need a more detailed view of the processing history, switch to the Trace level.
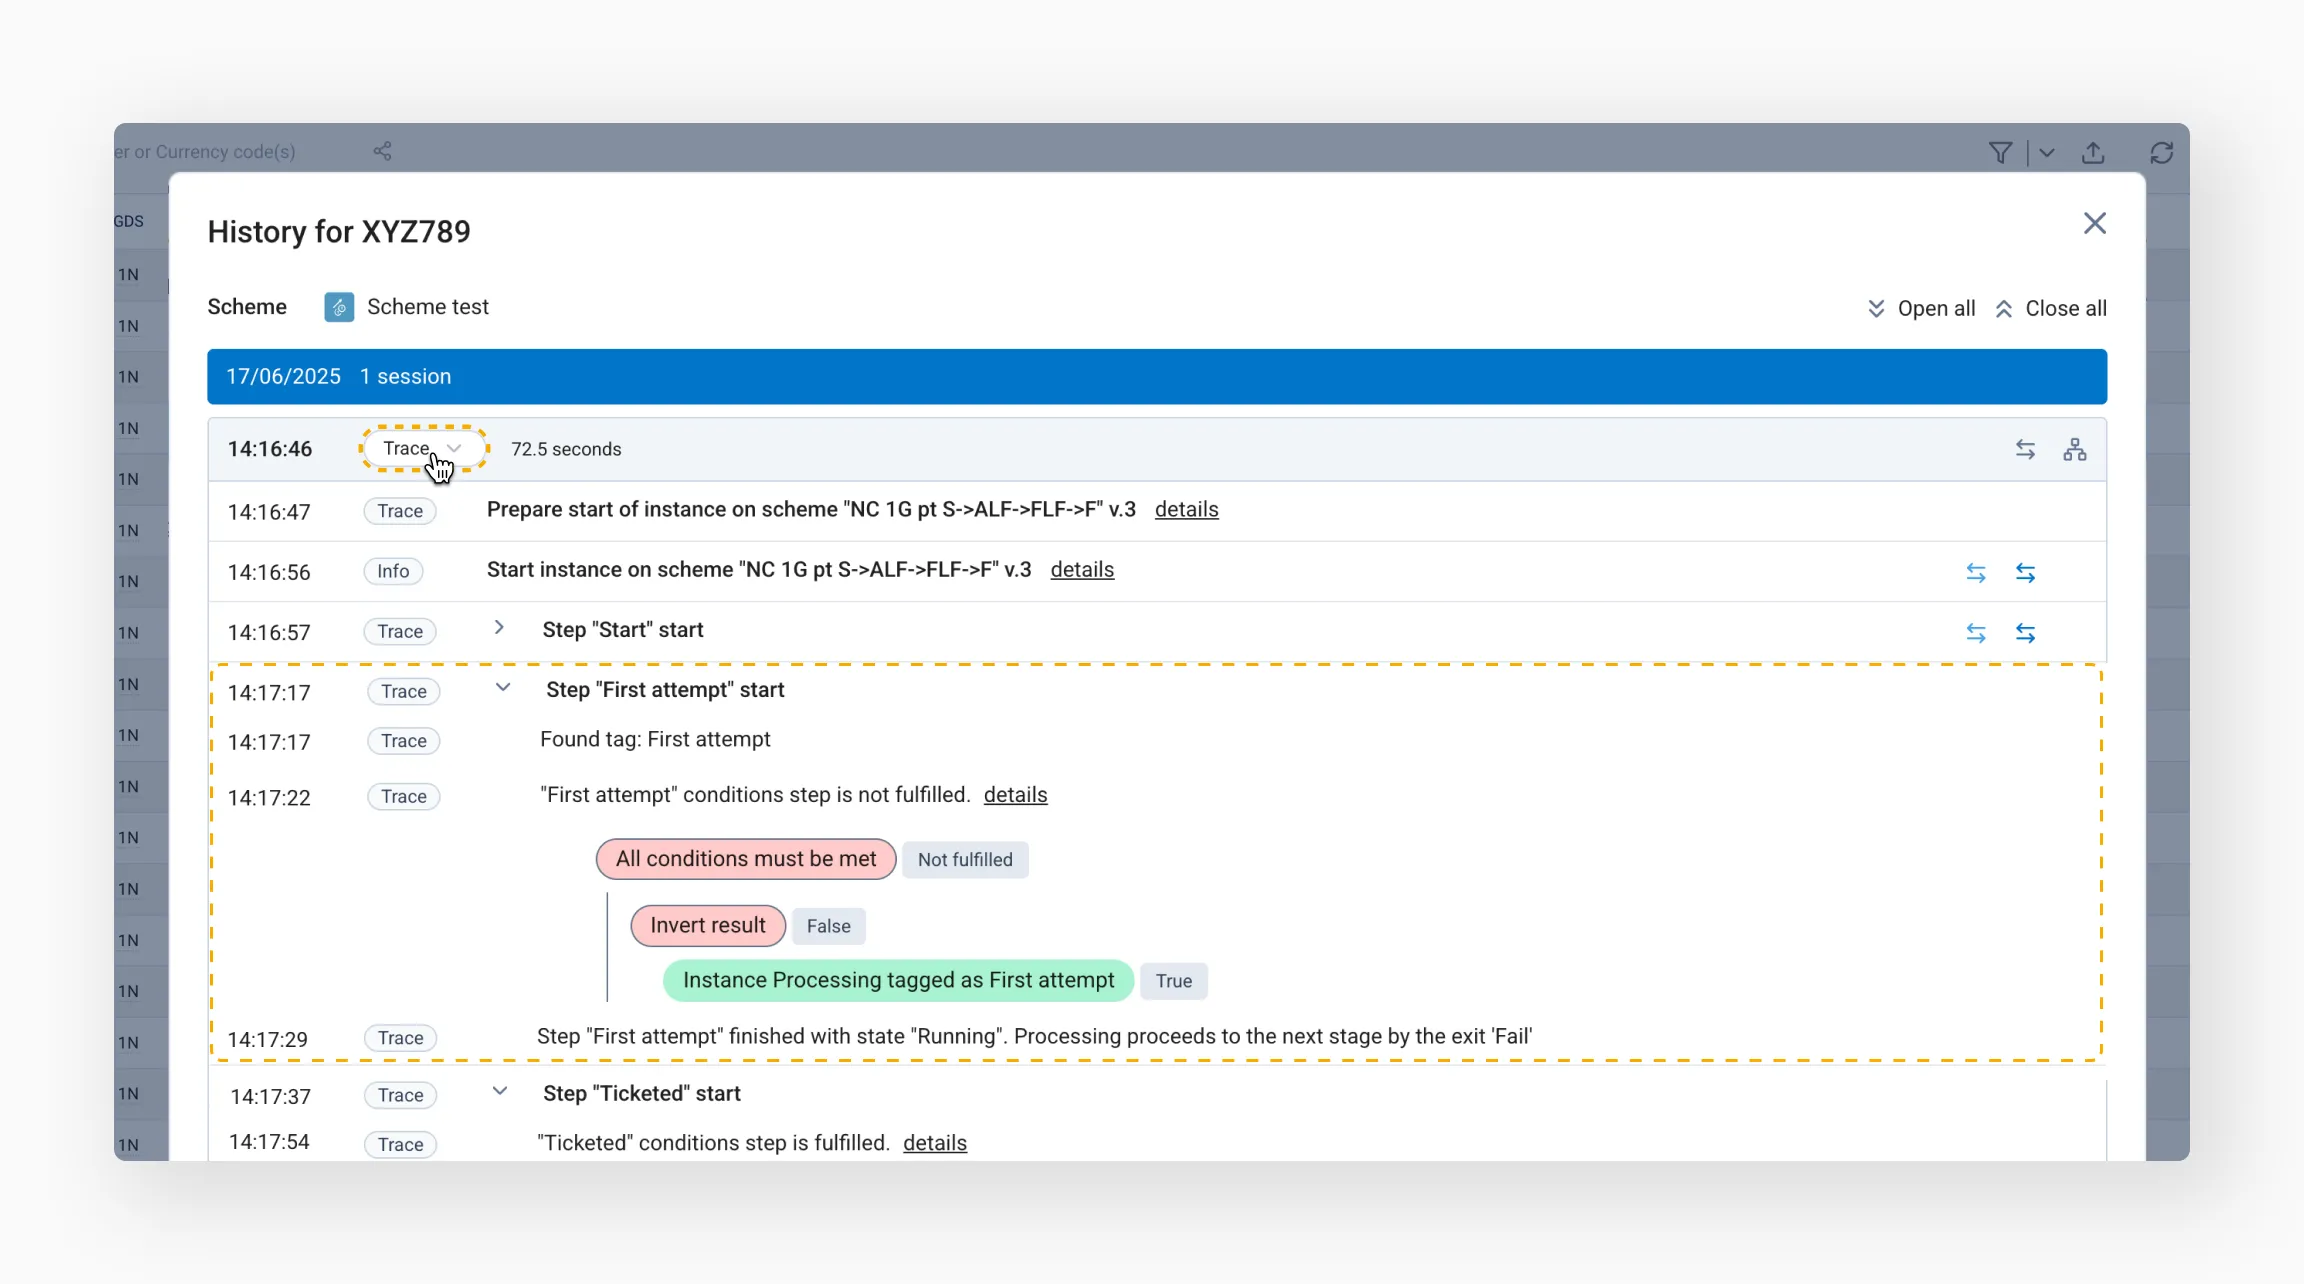
The Trace level shows the full processing path of the PNR within the scheme – not just how each action was executed, but also how the system processed conditions.
Information icons
Icons to the right of the instance row represent important events that occurred during the session:
- Sent e-mail
- Completed optimization
- Issued ticket
- Error
- Warning
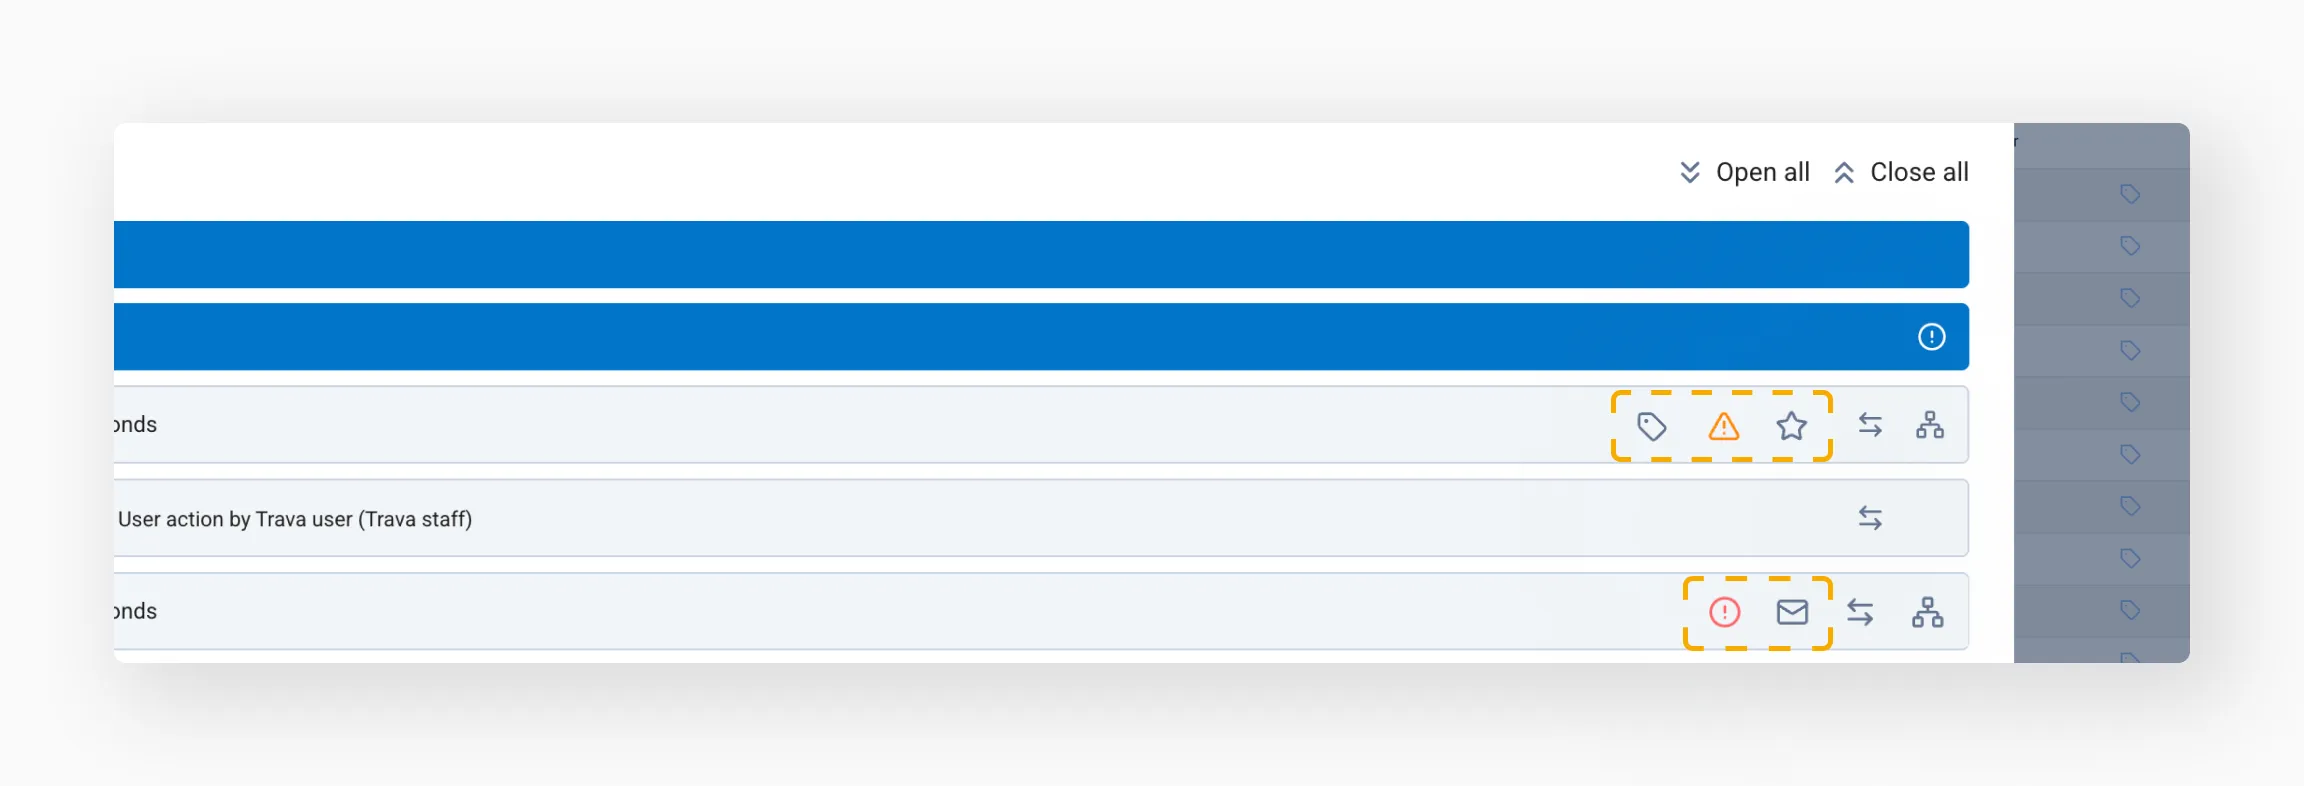
Click them to see details.
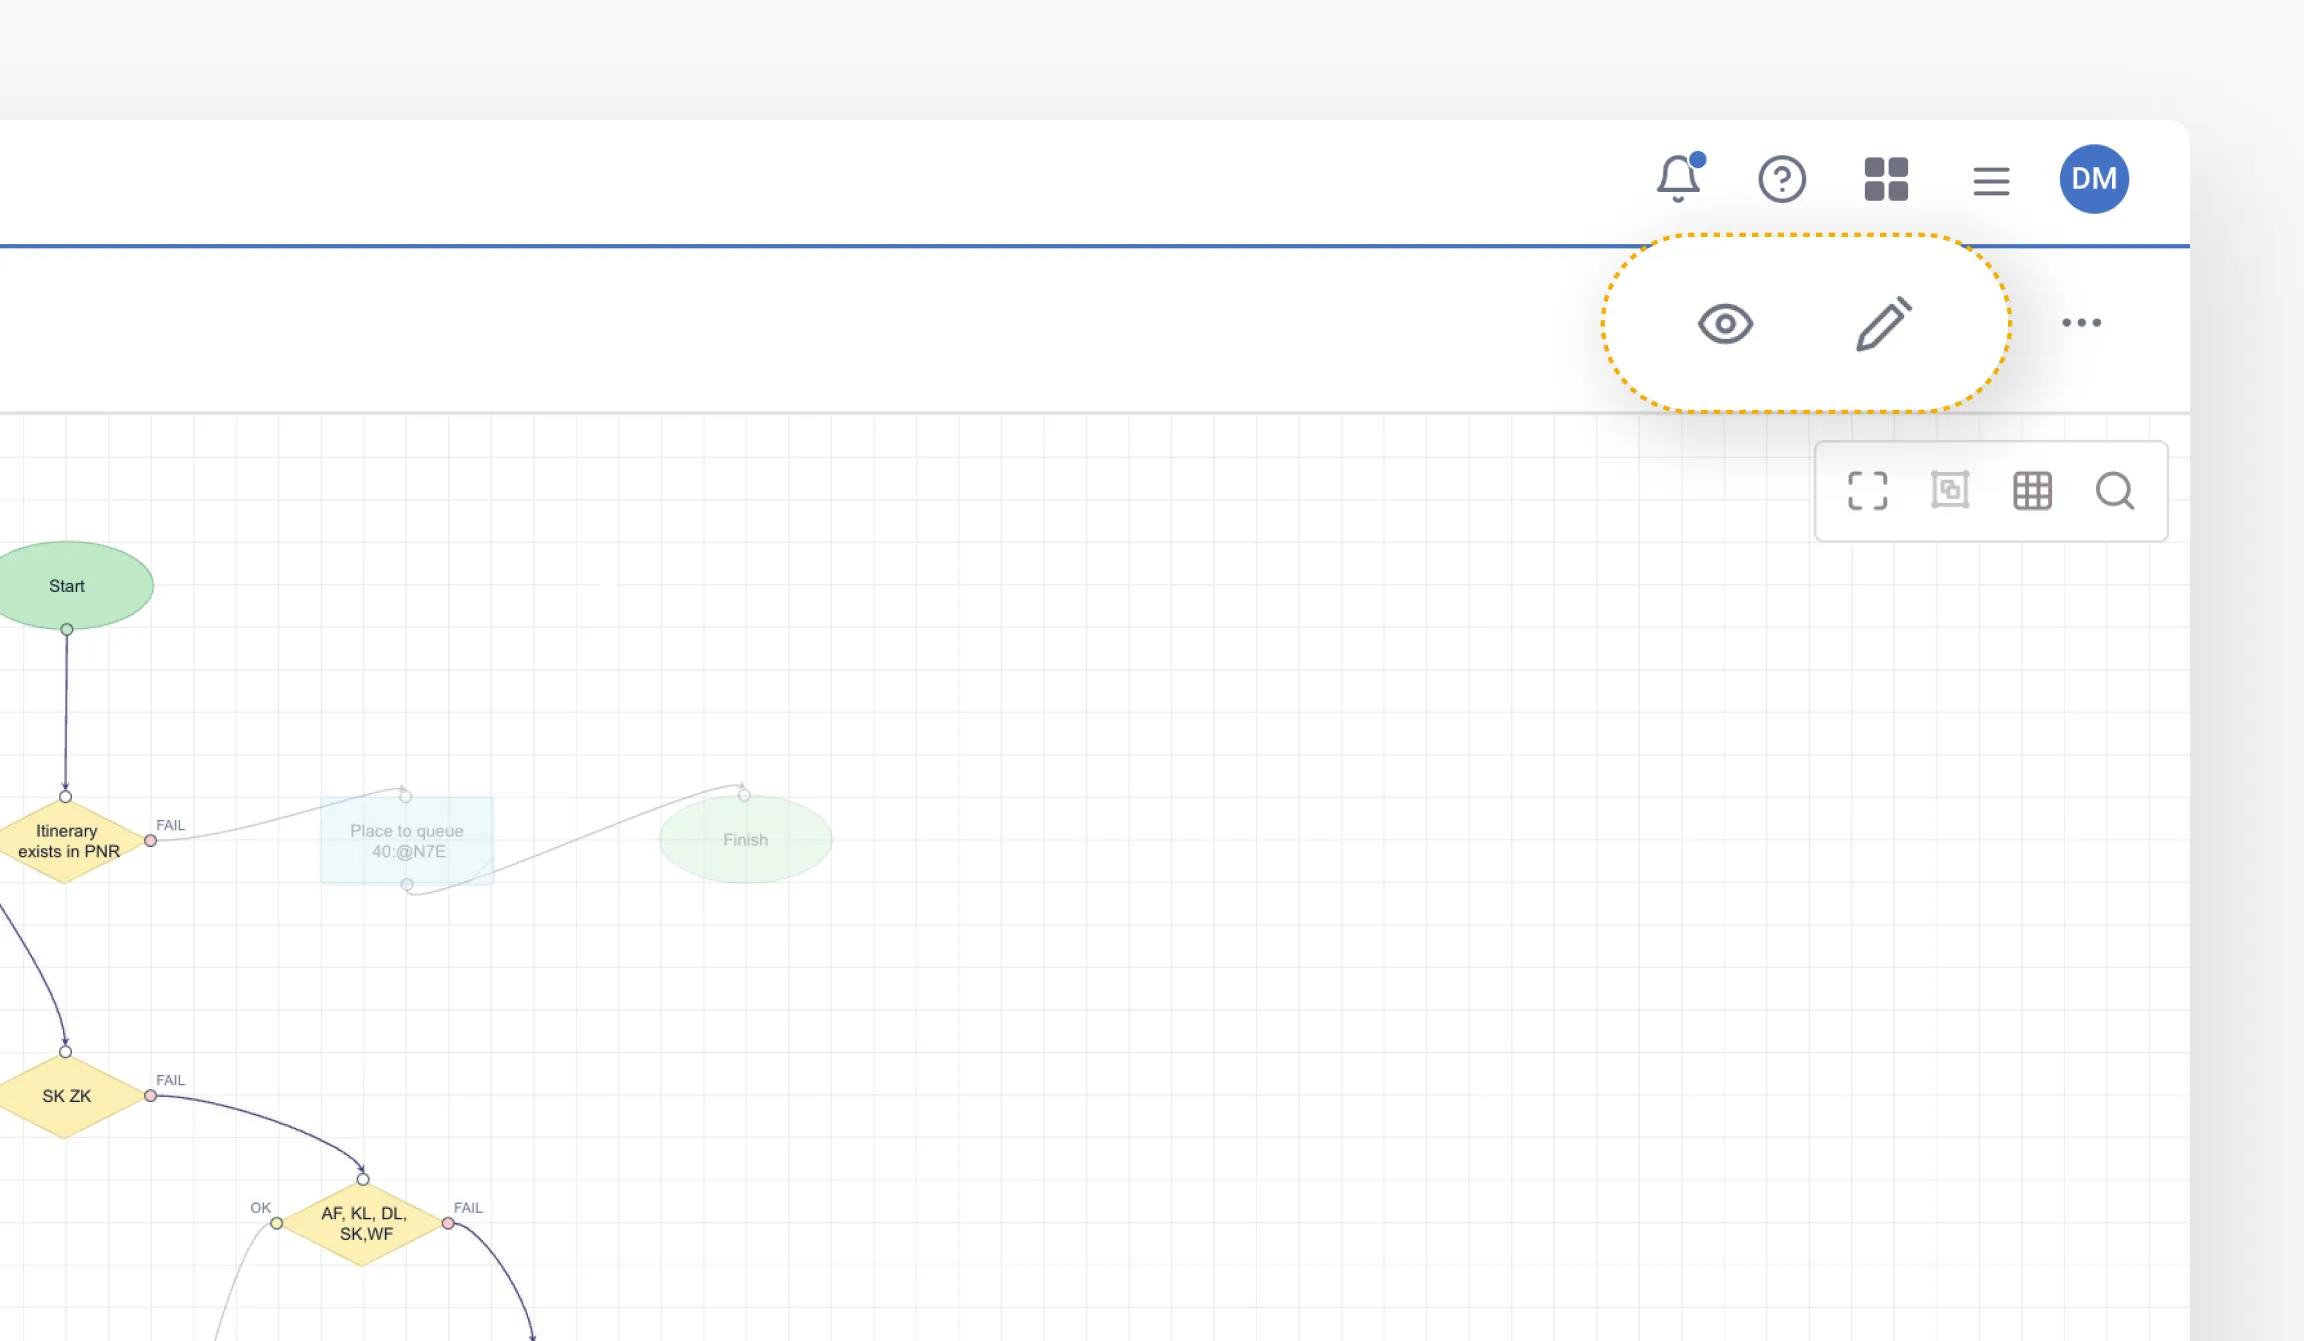
Actions
In each session row, you can navigate to more details.
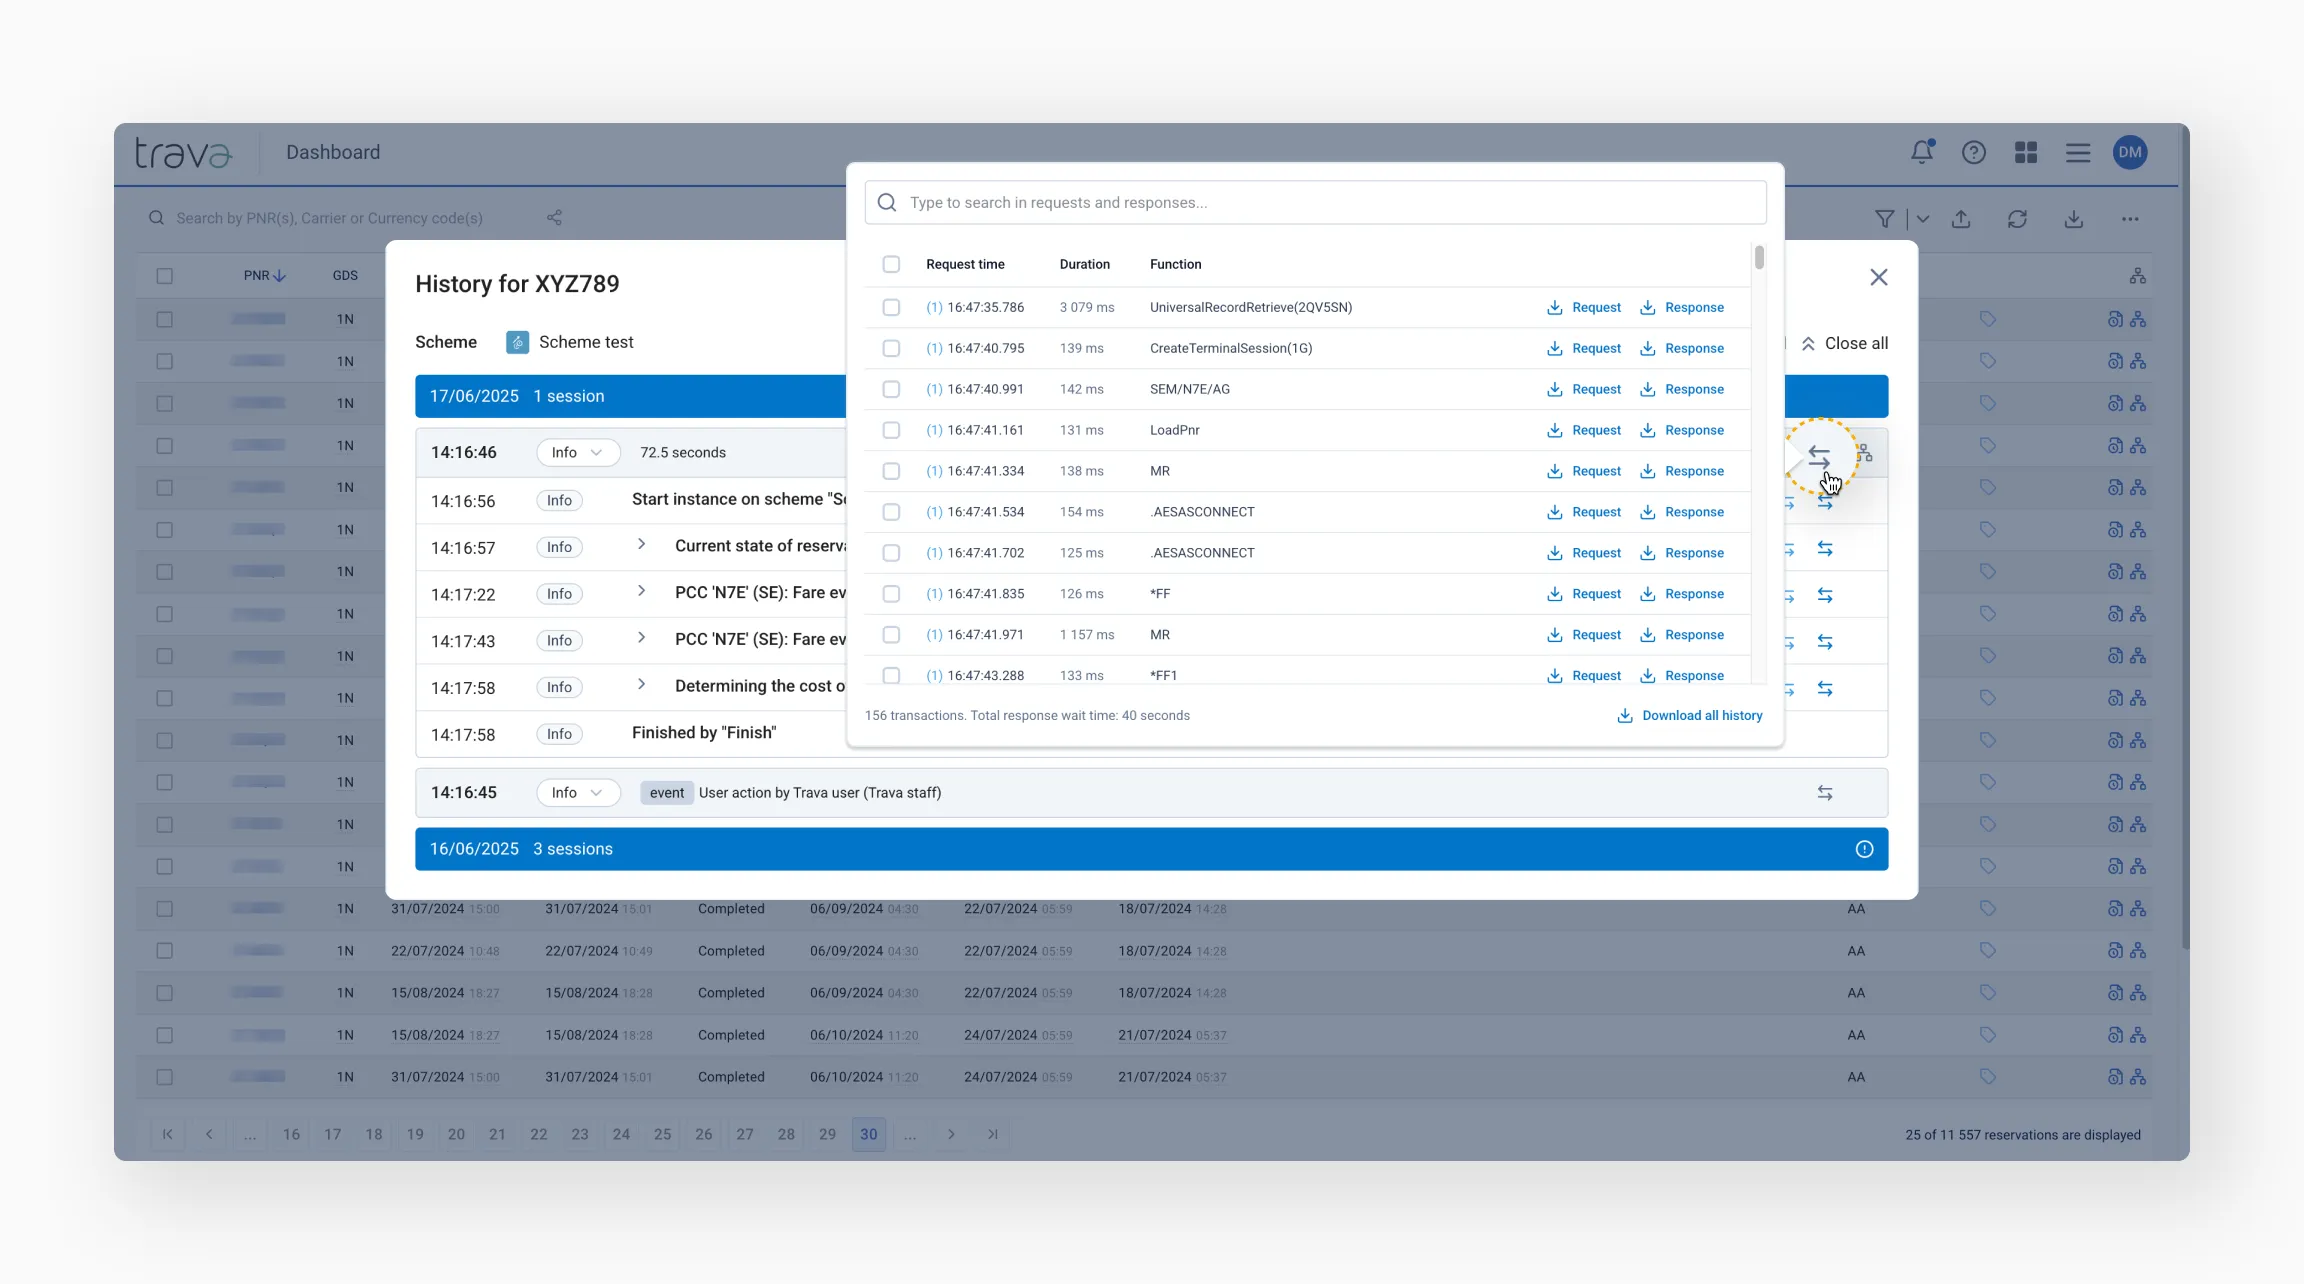
View web logs
Logs follow a request–response format and show which data was requested, how it was requested, and what responses were received.
View scheme path
A scheme opened from the processing history highlights only the steps that were actually executed during that processing run.
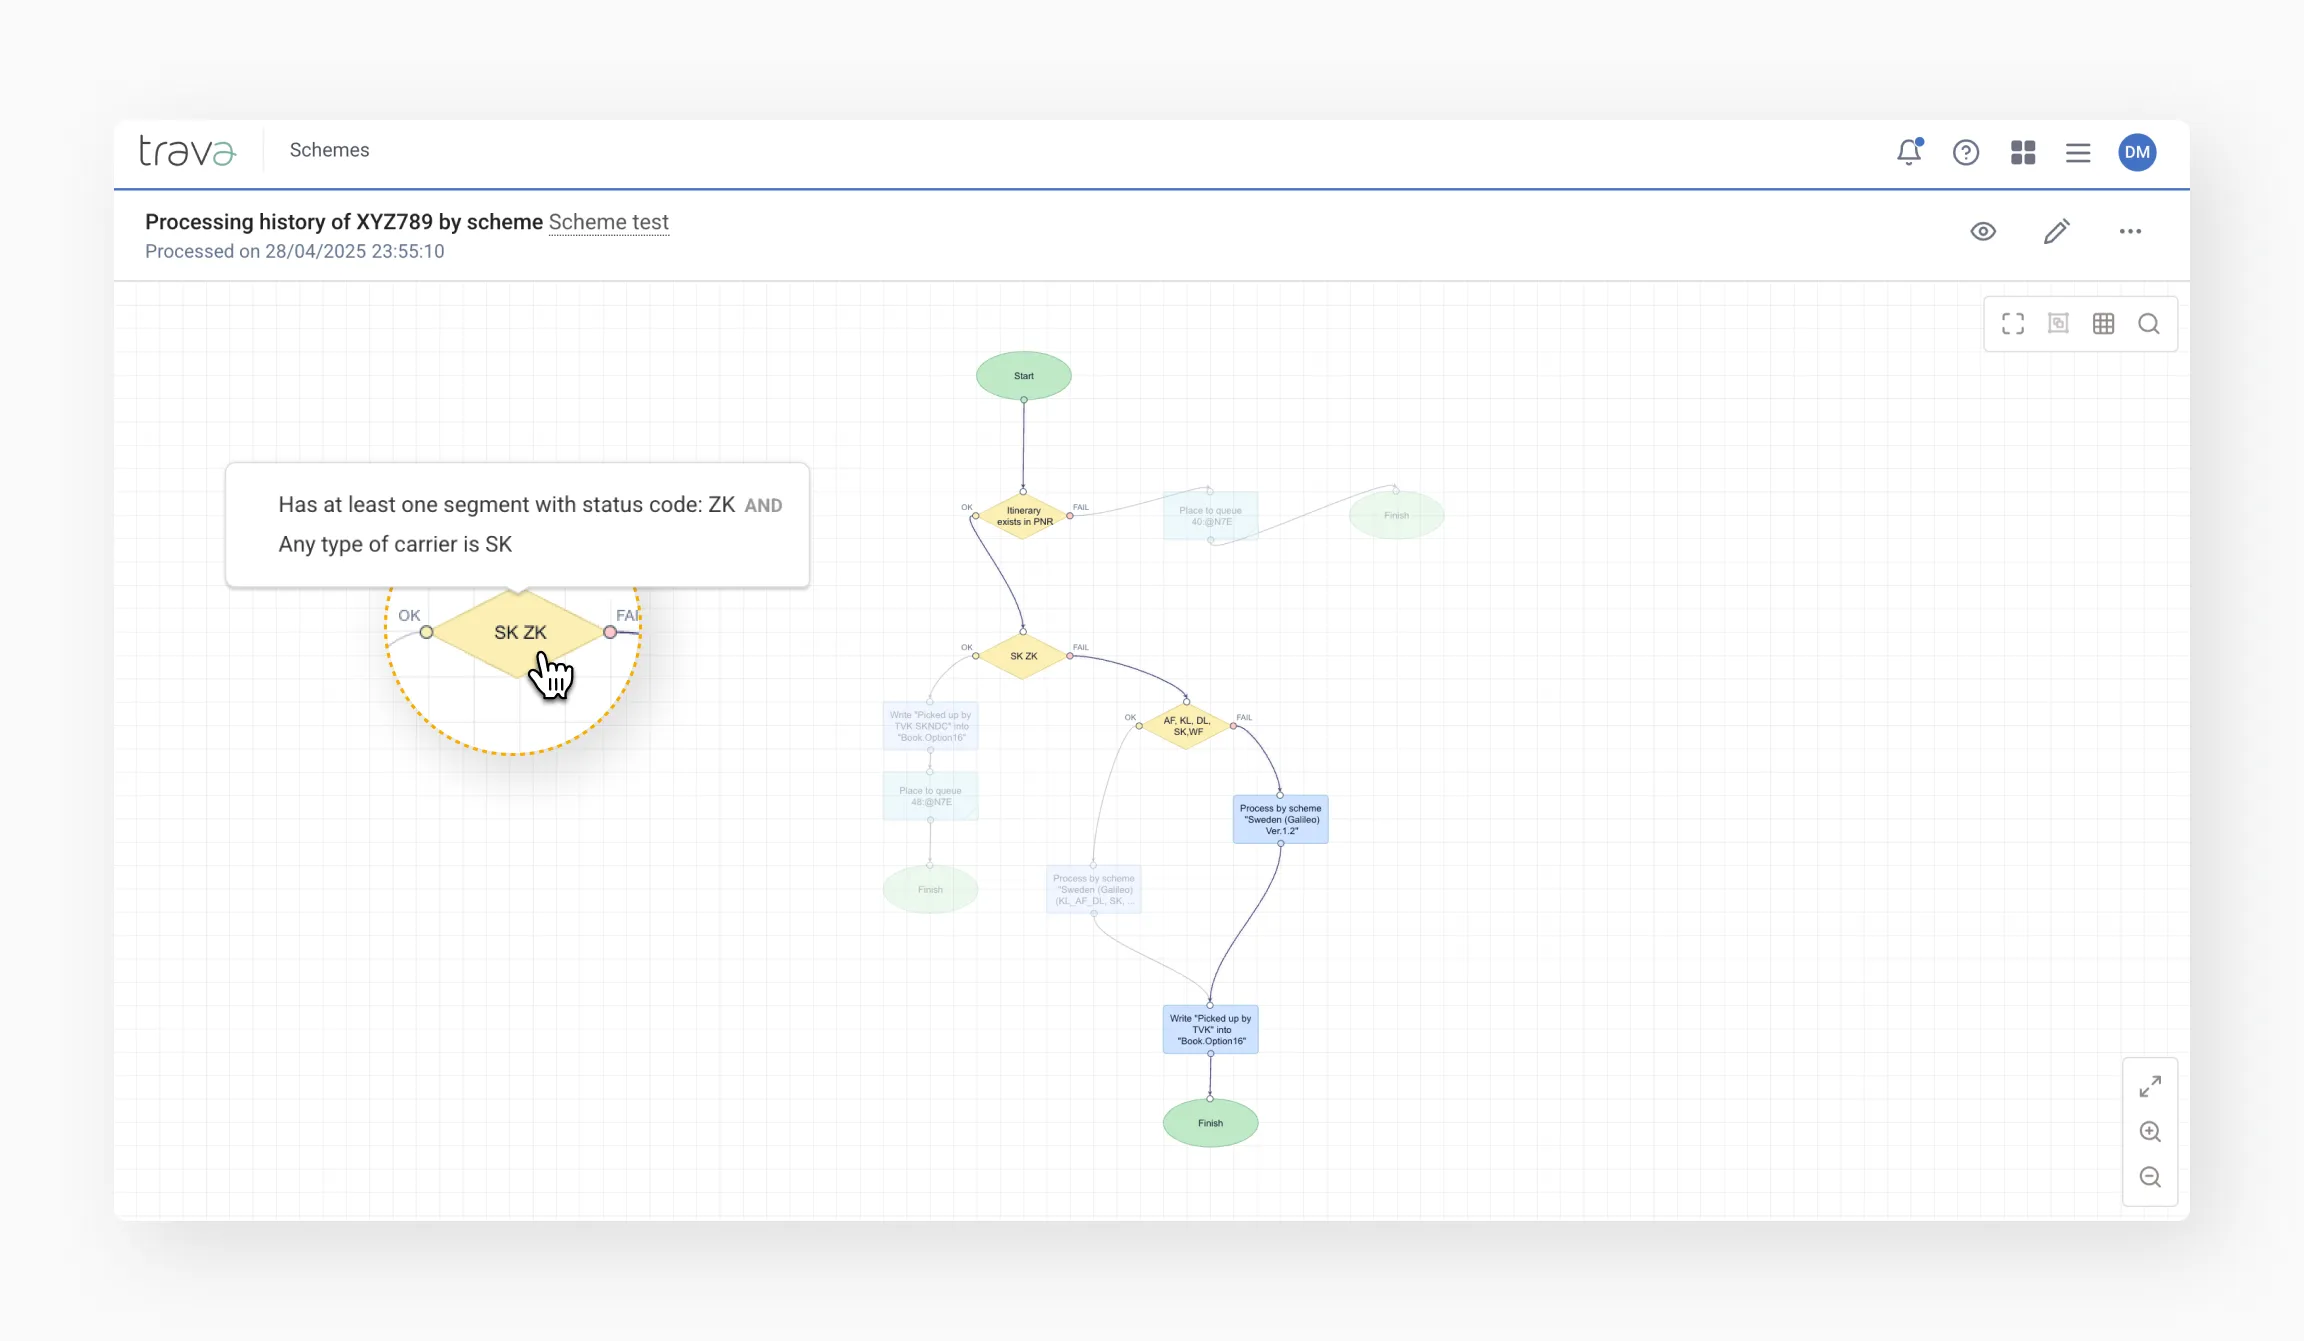
This scheme displays a Processing history label in the top left corner, showing the PNR number, scheme name, and date and time of processing. Hover over or double-click an element to see its configuration.
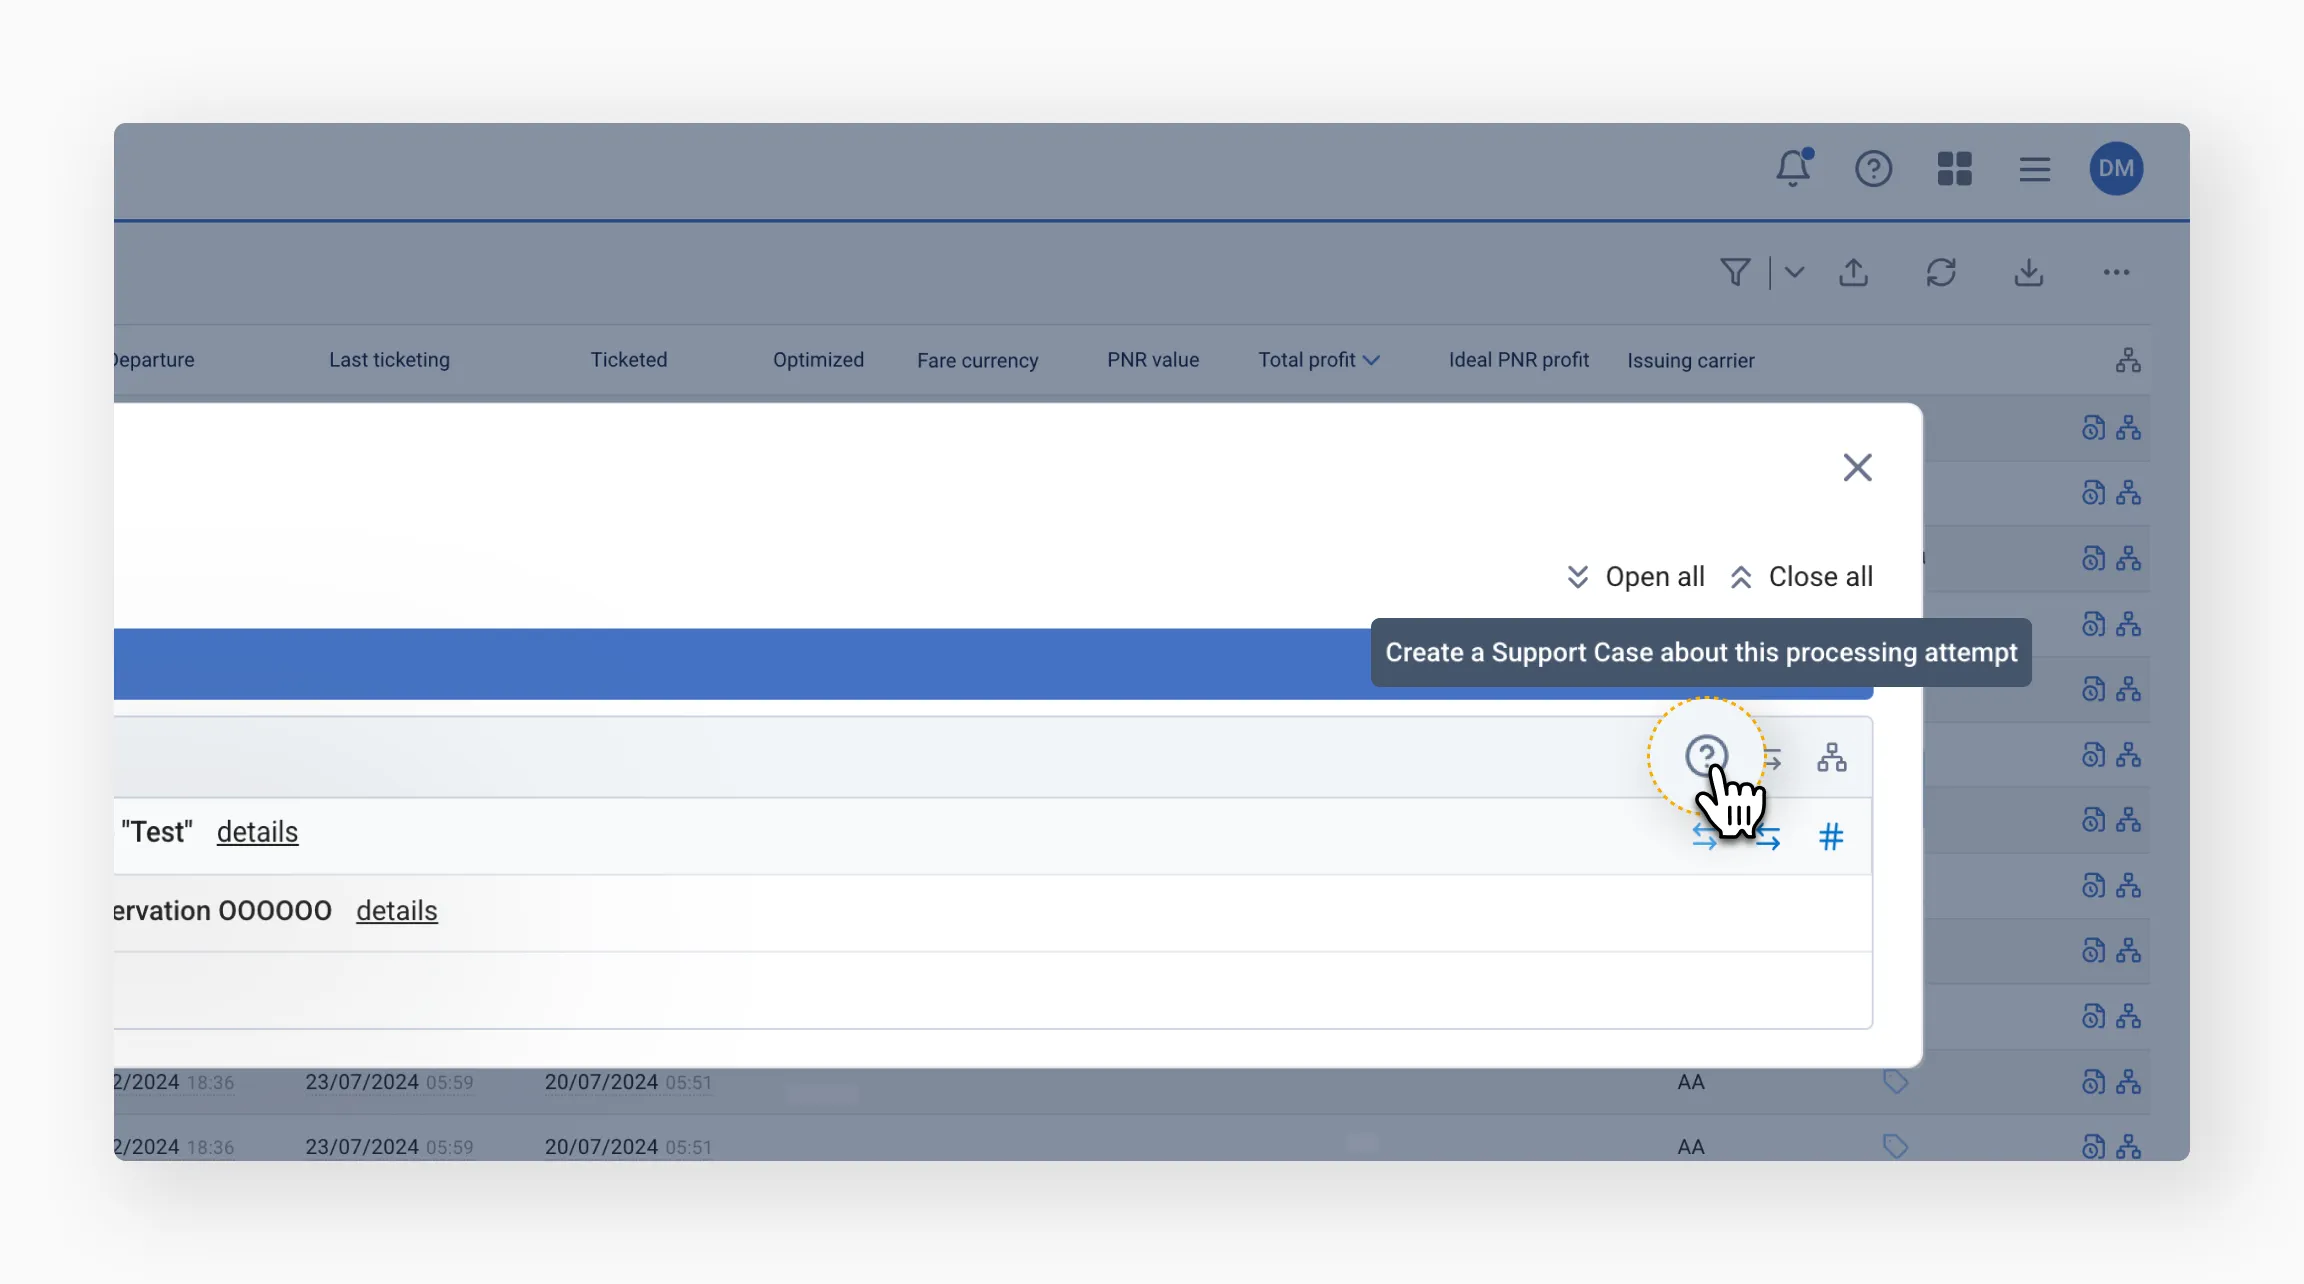
A single click on an element opens an additional menu:
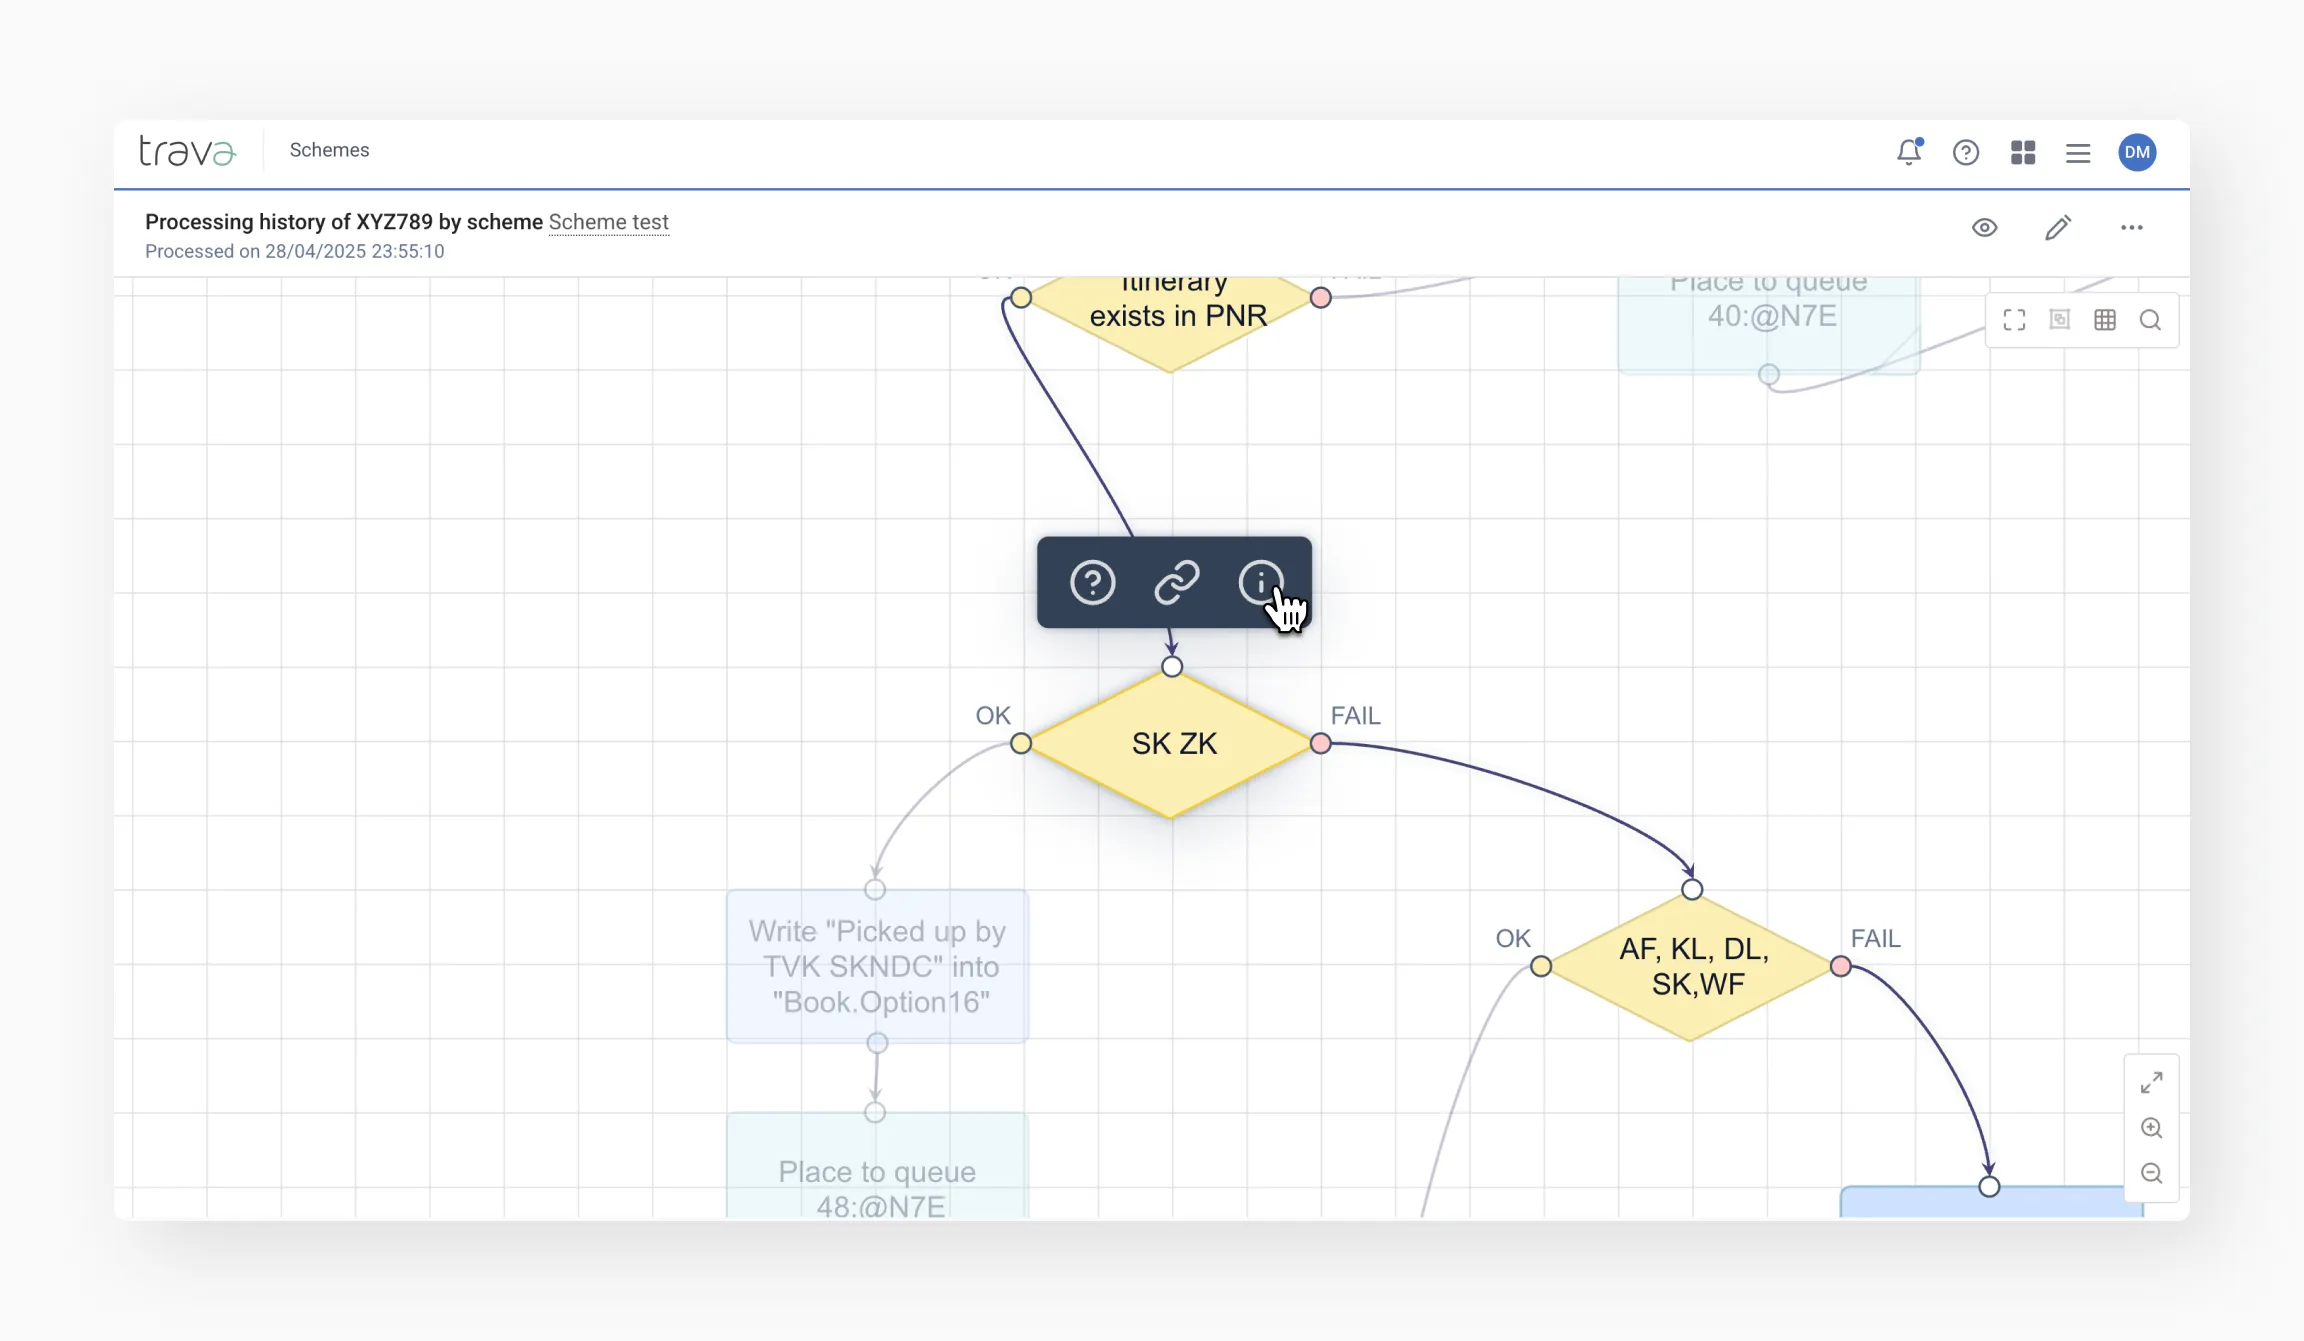
- Question mark – quickly create a support ticket with a link to this element
- Link – copy link to the element
- Info icon (i) – view detailed processing information, including which checks were performed
From here, you can edit your scheme or view its current version.
Grouped conditions and inversions
OR conditions
When conditions are combined with OR, the block follows the OK path if any group is satisfied. The system checks condition groups in order and stops at the first group that returns OK.
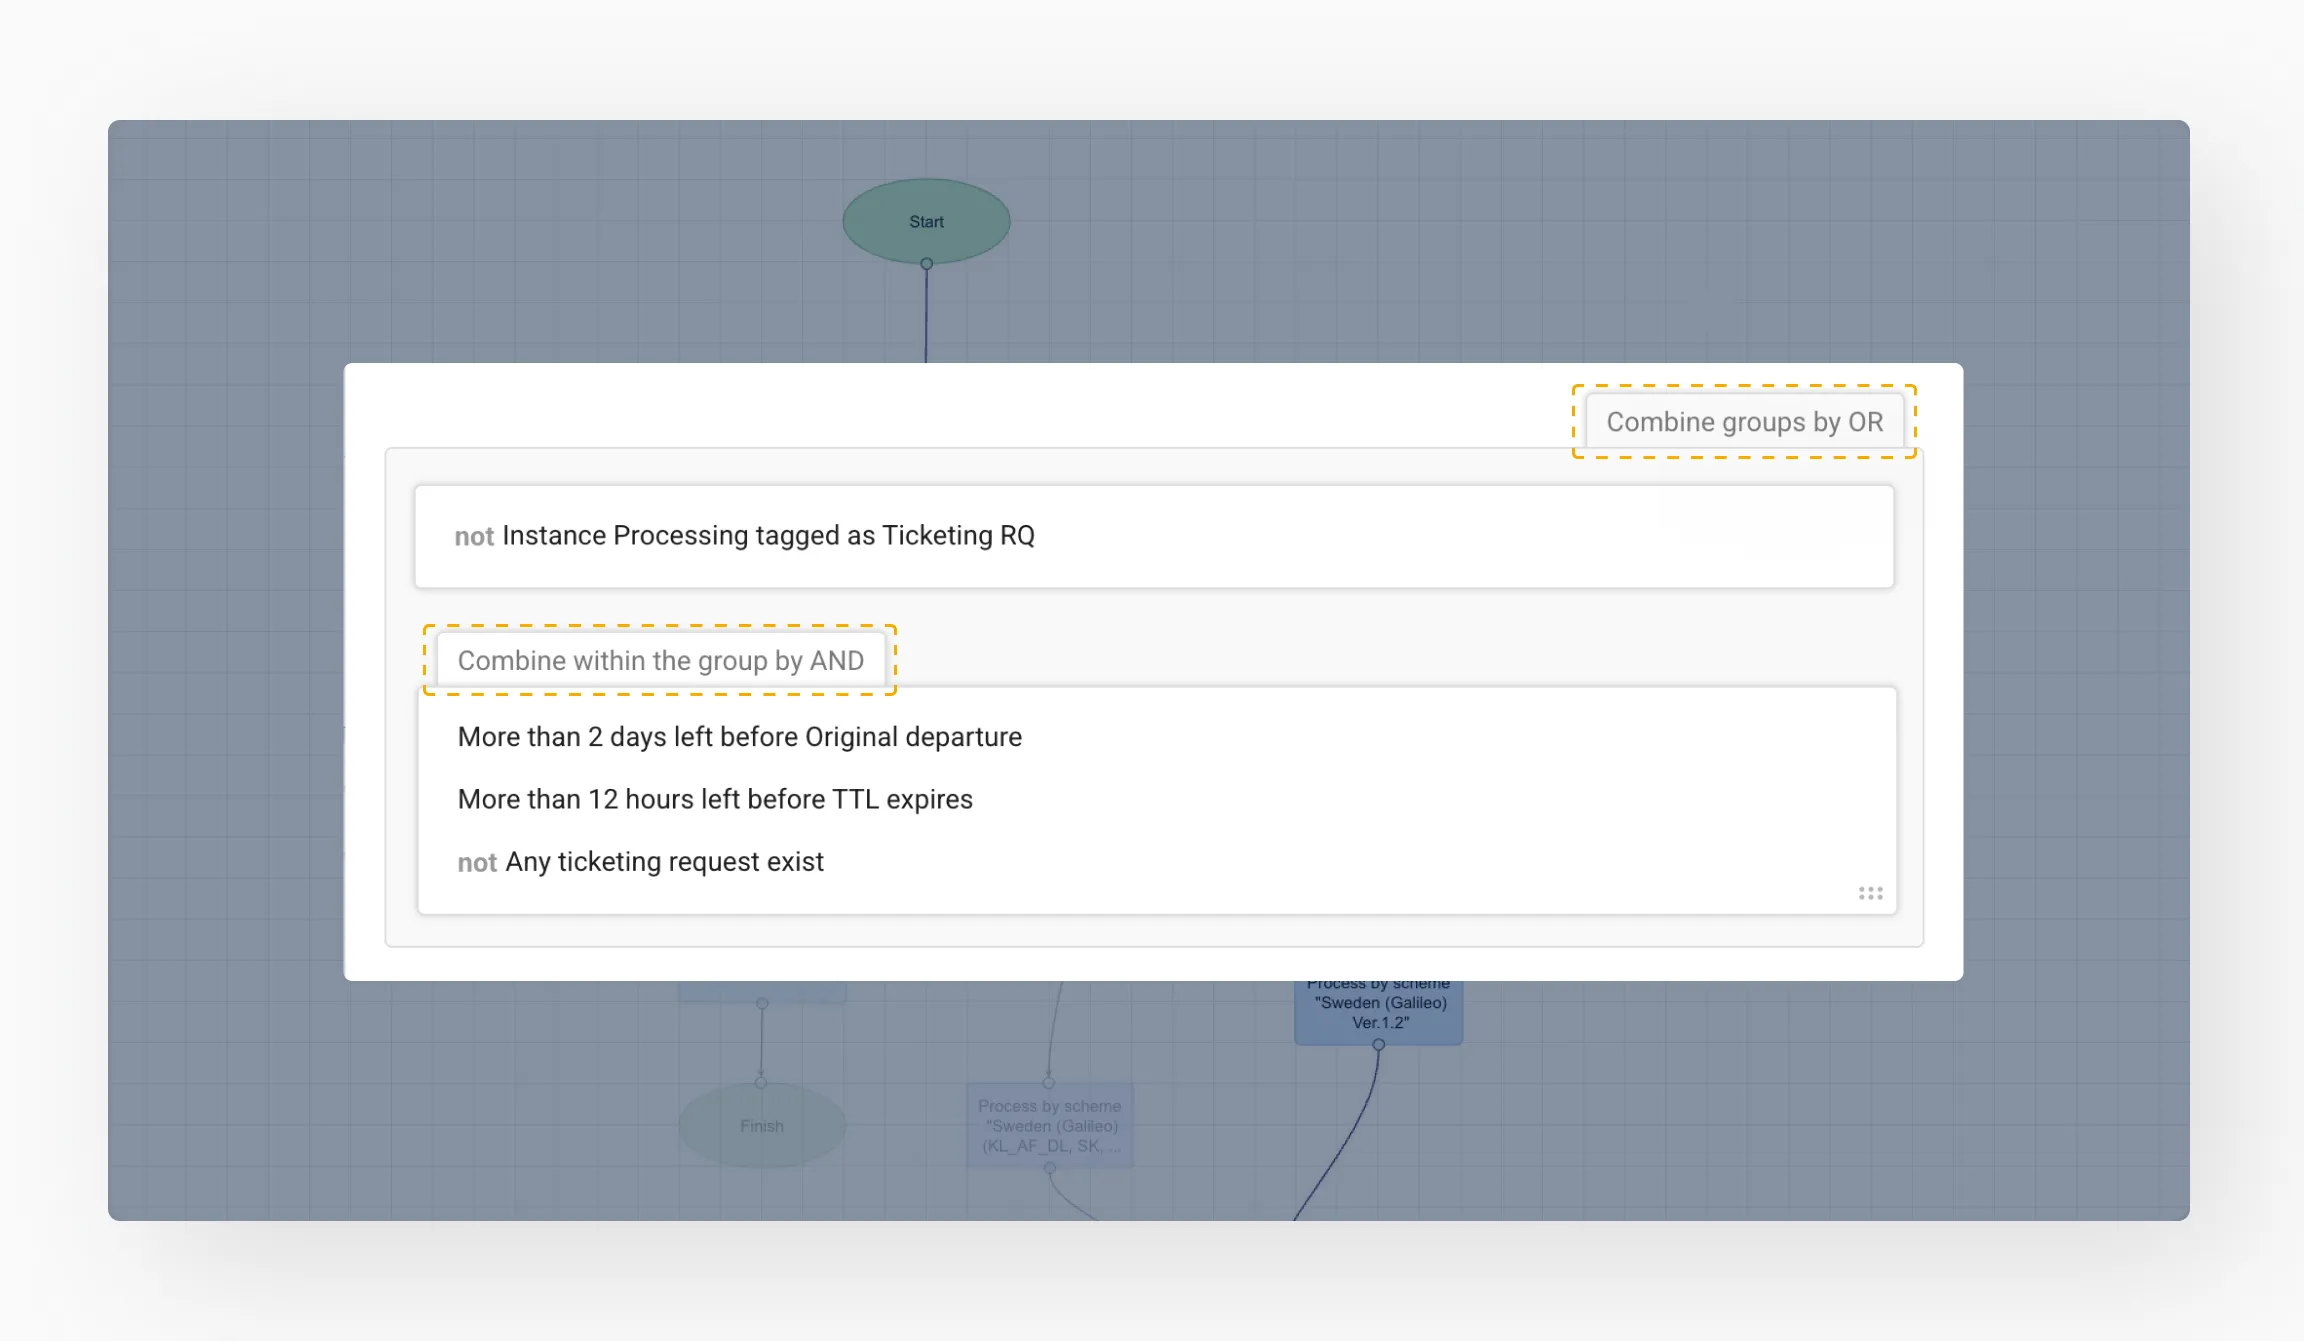
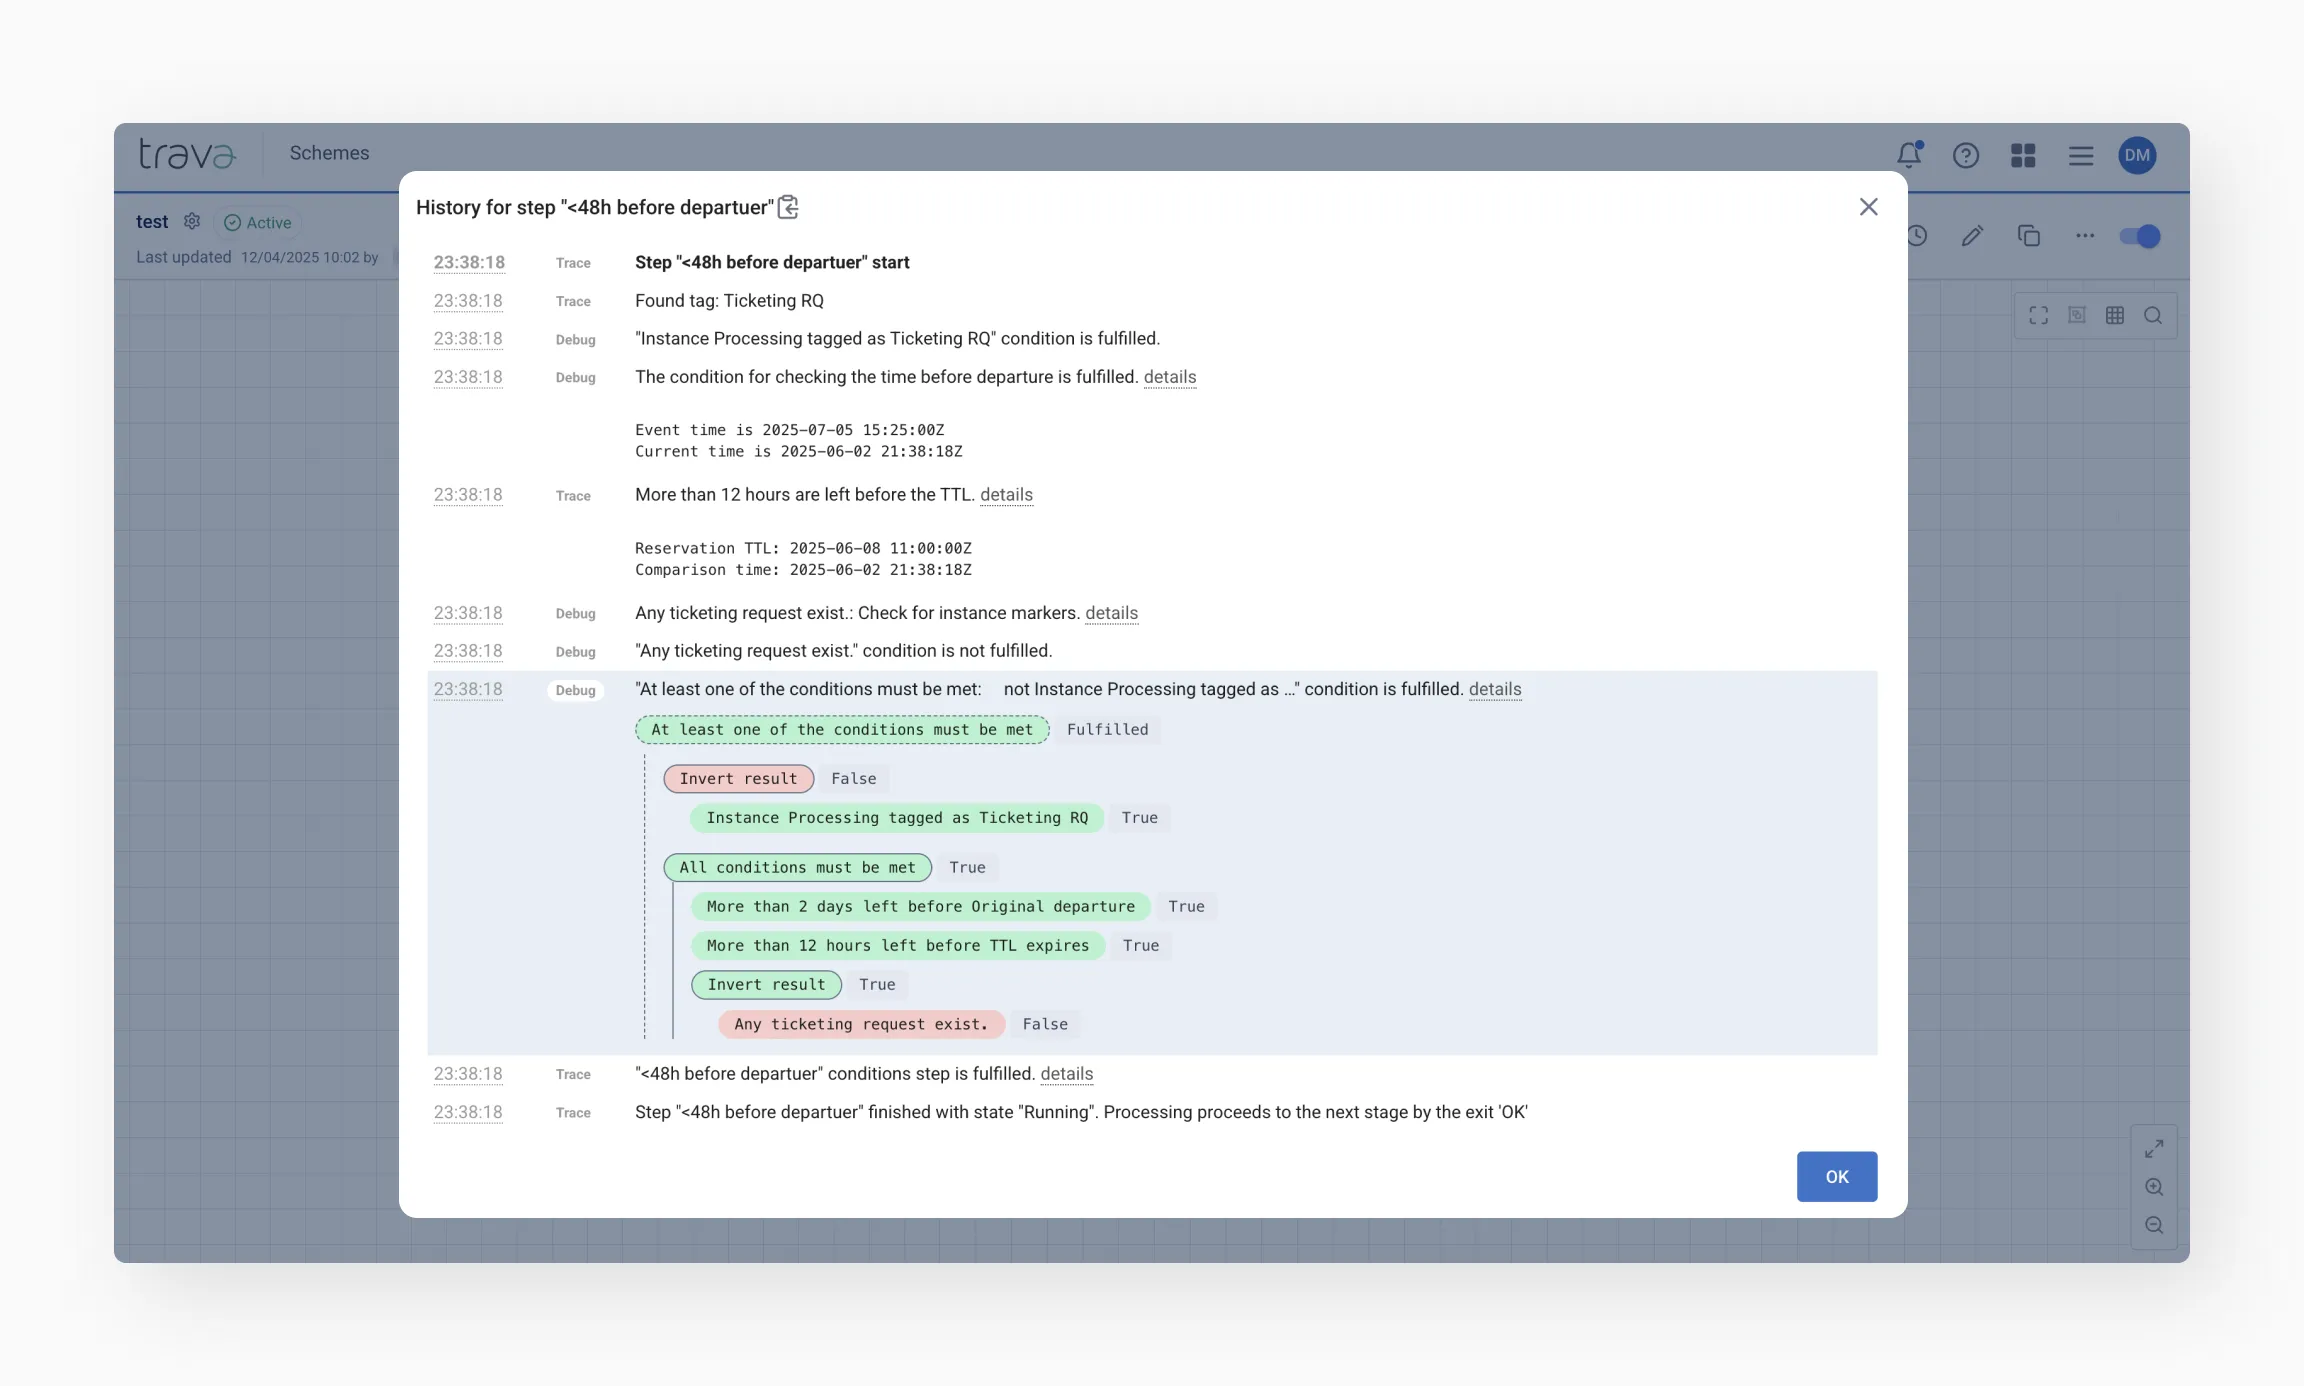
For example, in the case below, the first group failed because the tag was found, but the condition required it to be absent. The system then moved to the second group, which was met, resulting in an overall OK outcome.
If the same rule were ordered differently, the system might find OK in the first group and skip checking the second one. You’ll see this in the history – unprocessed groups are marked accordingly.
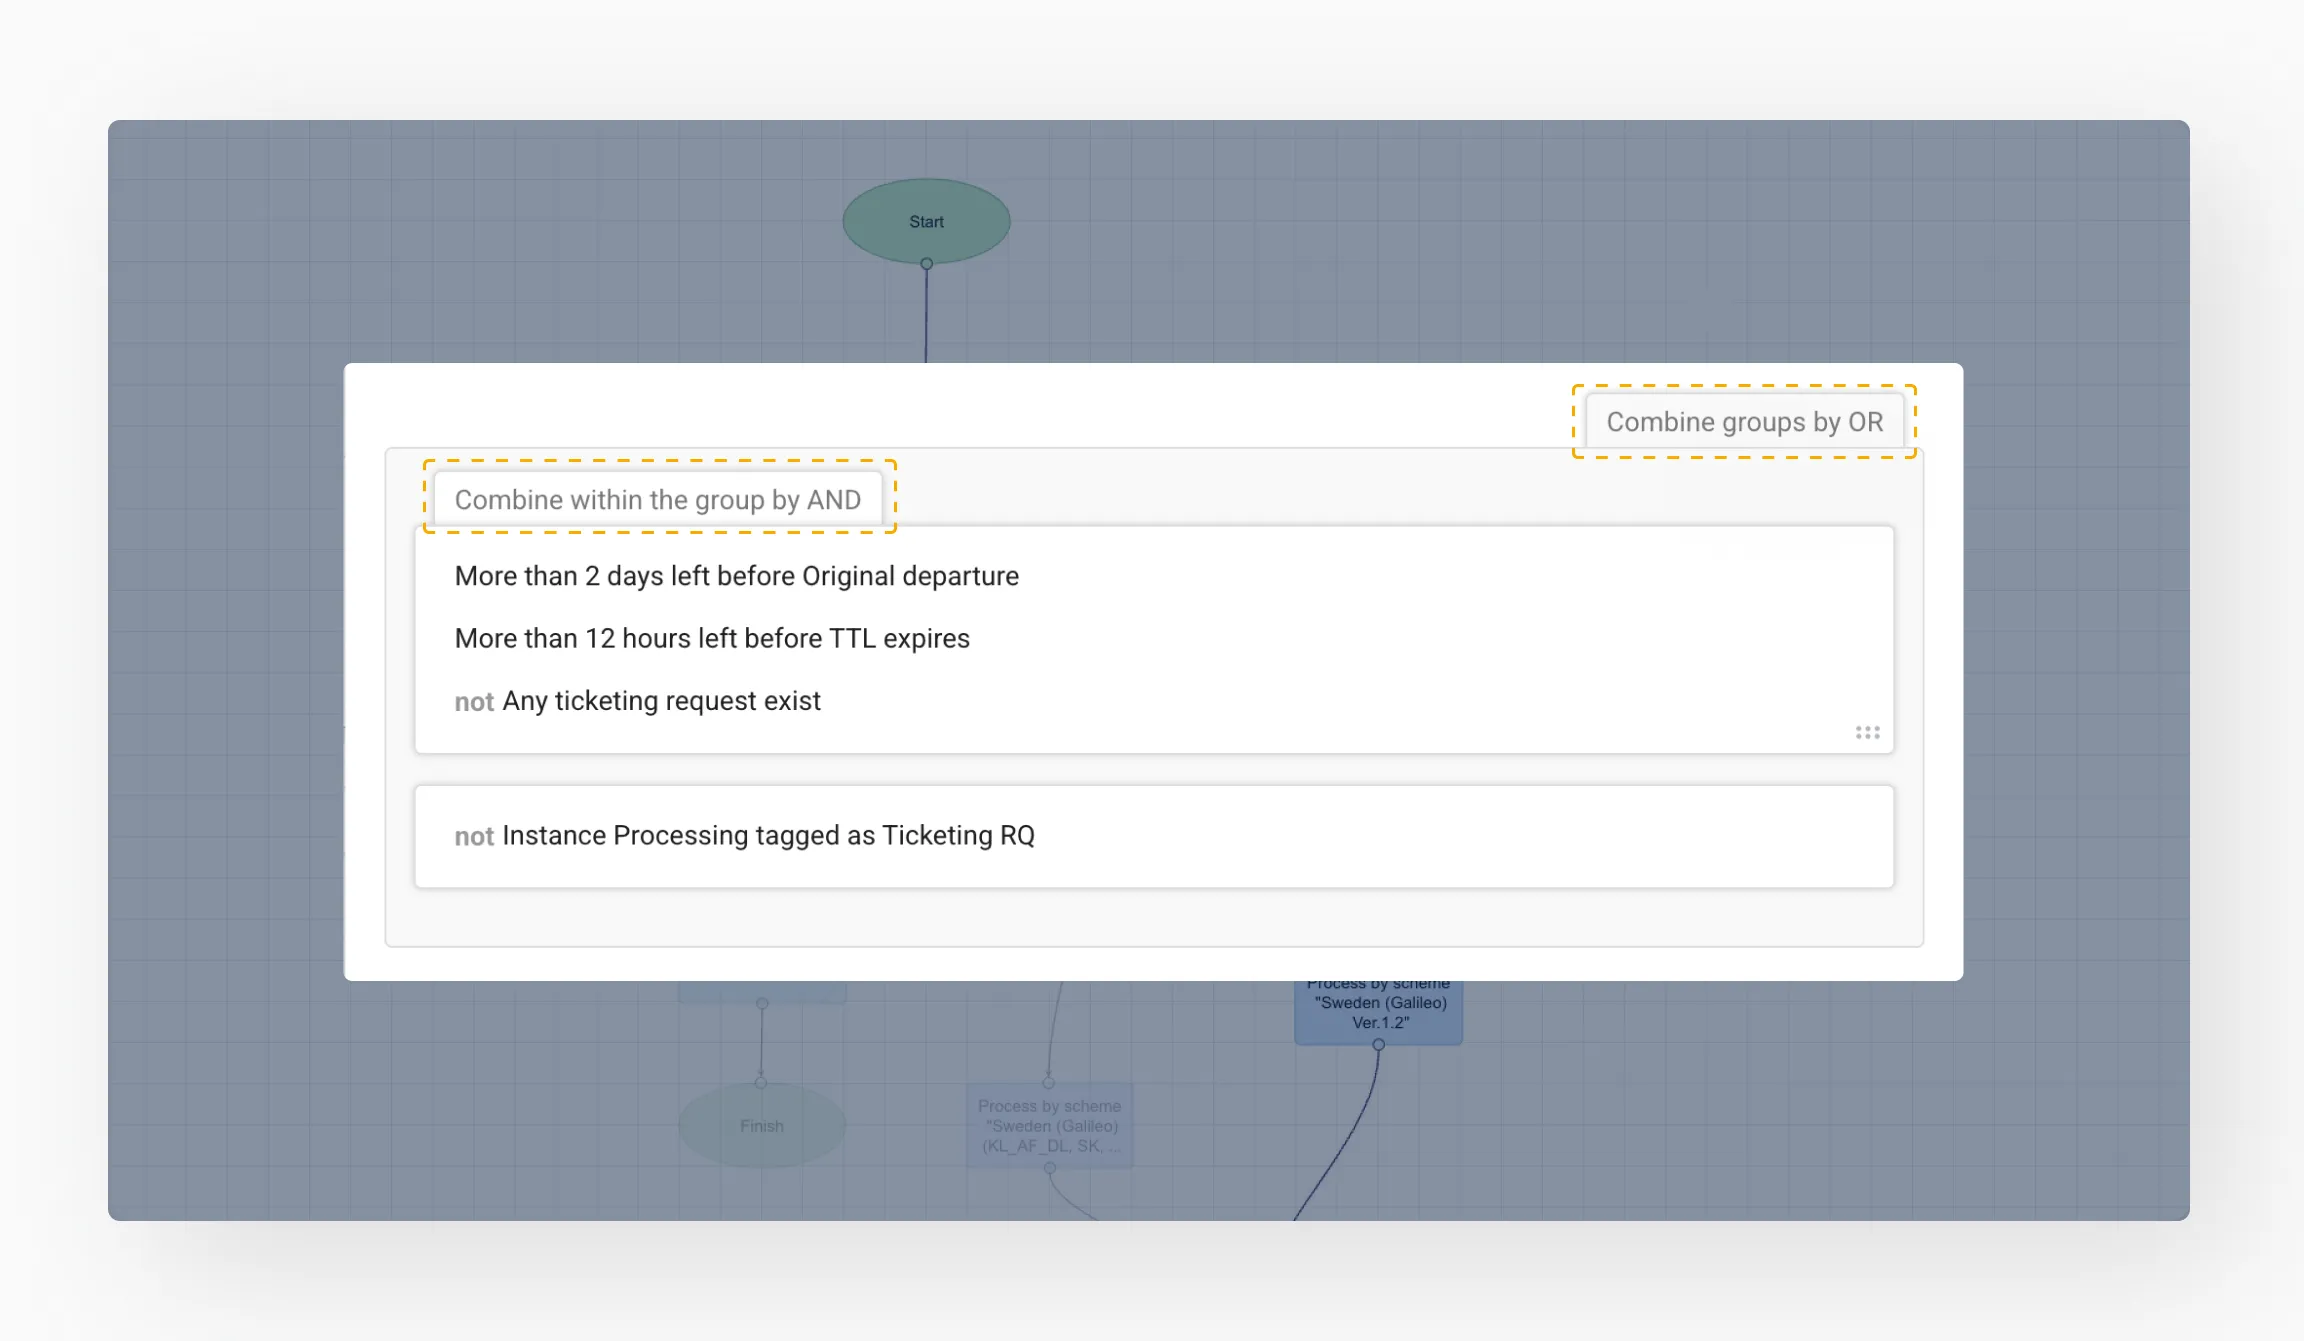
The system would find an OK result in the first group and wouldn’t check the second group at all.
In the image below, you can see that the second condition group was not evaluated because the first one returned OK.

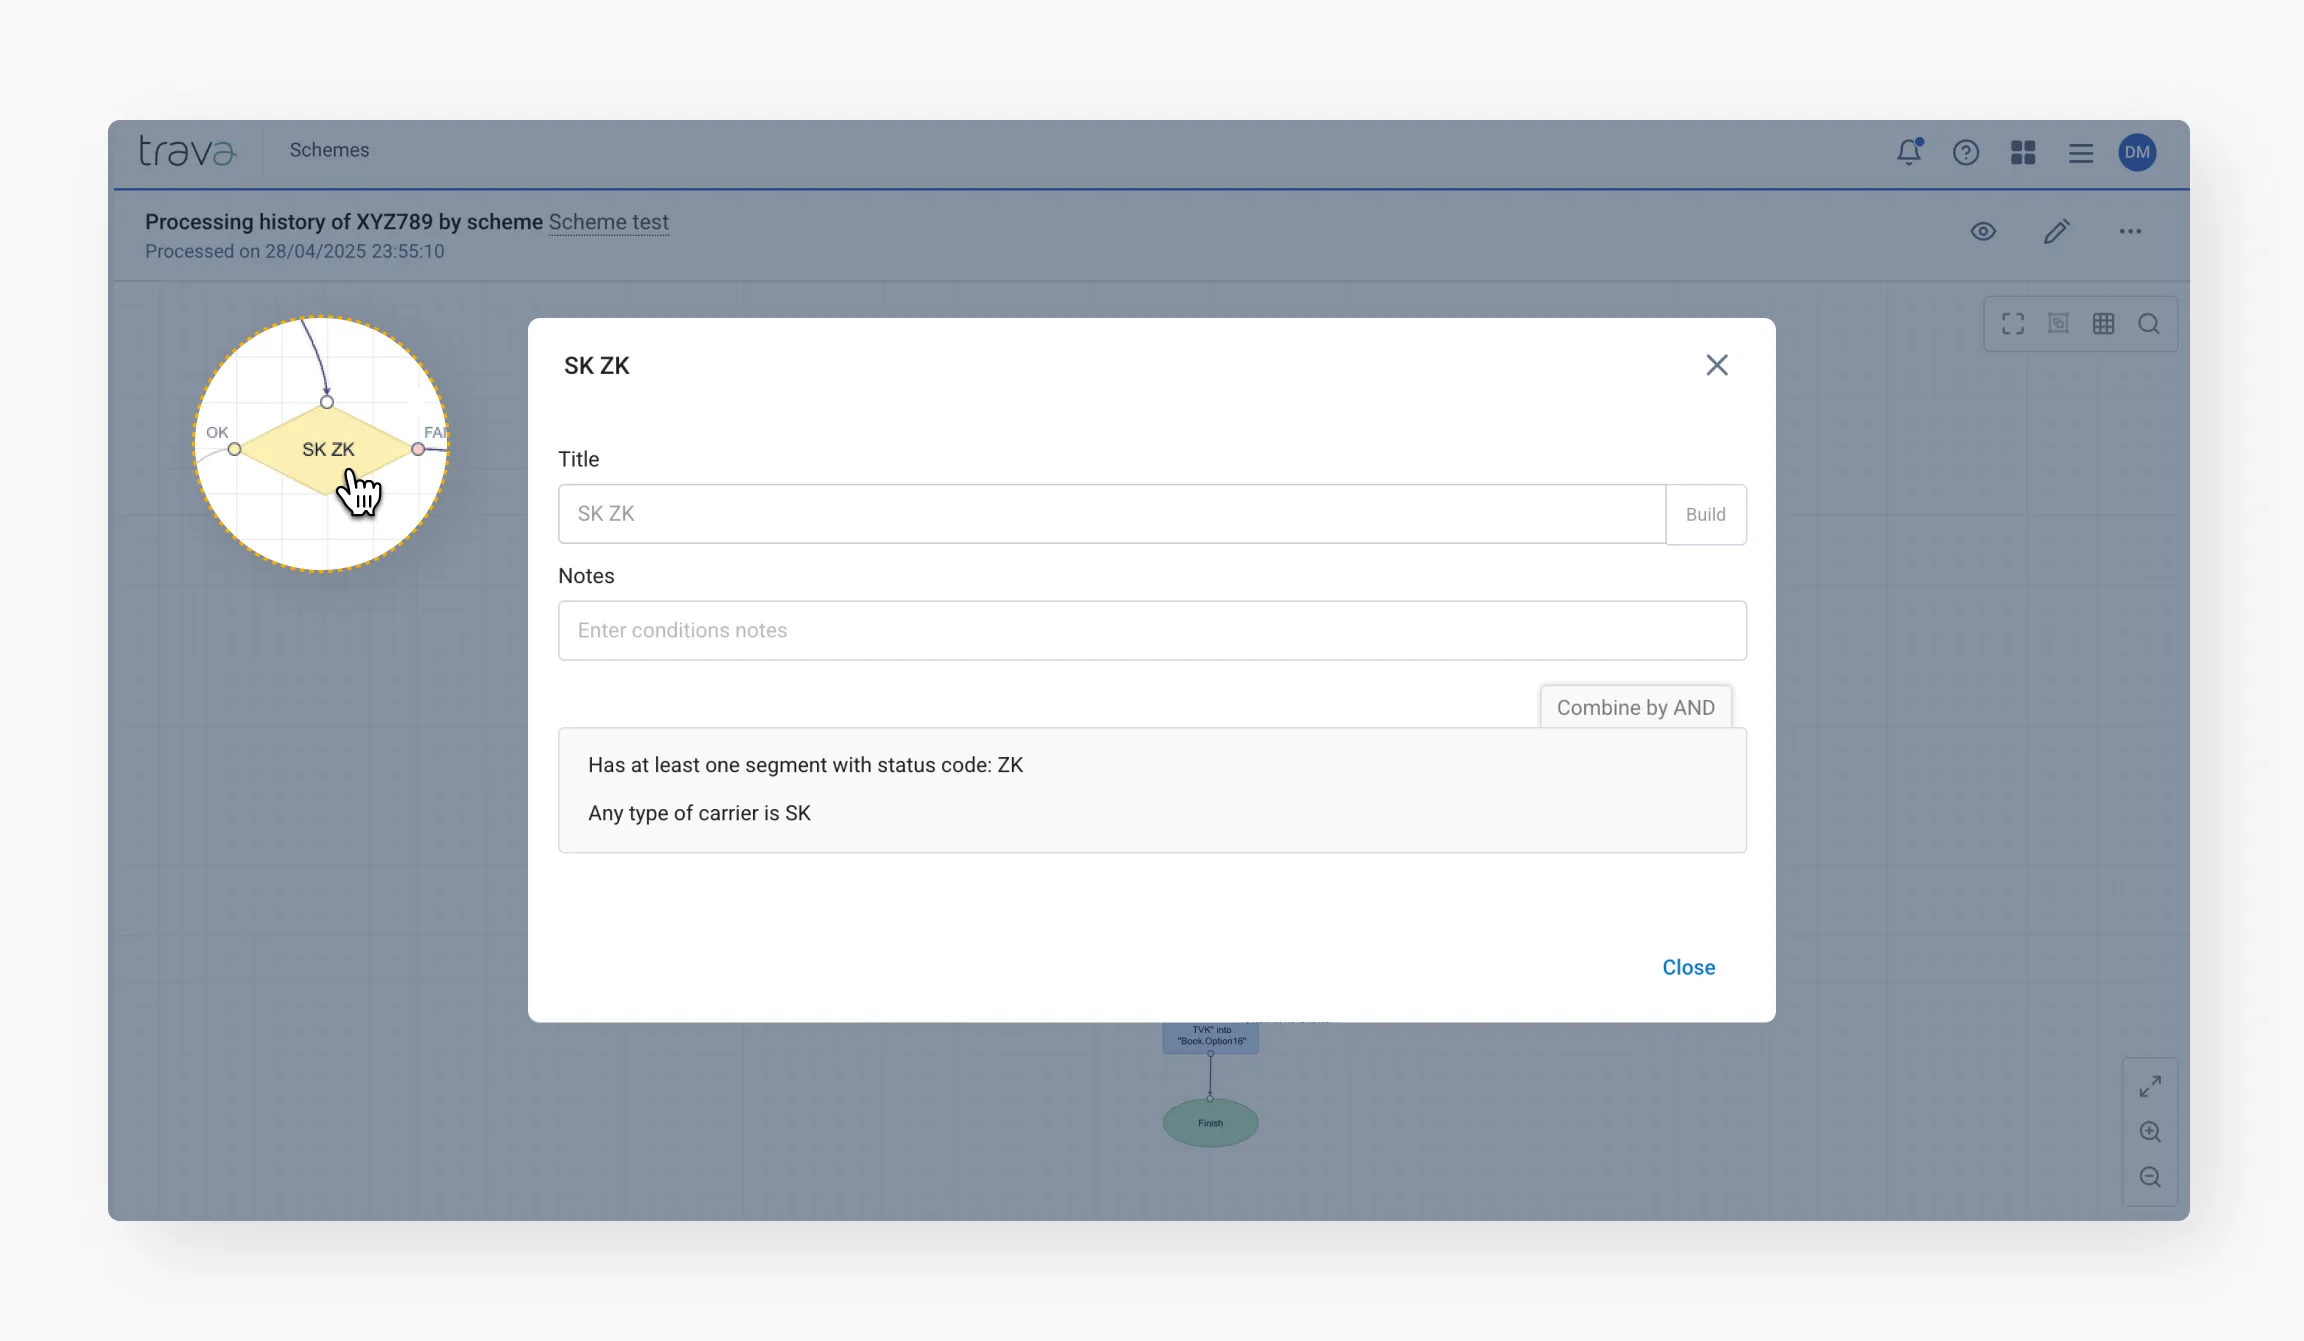
AND conditions
If conditions are combined with AND, all groups must be met.
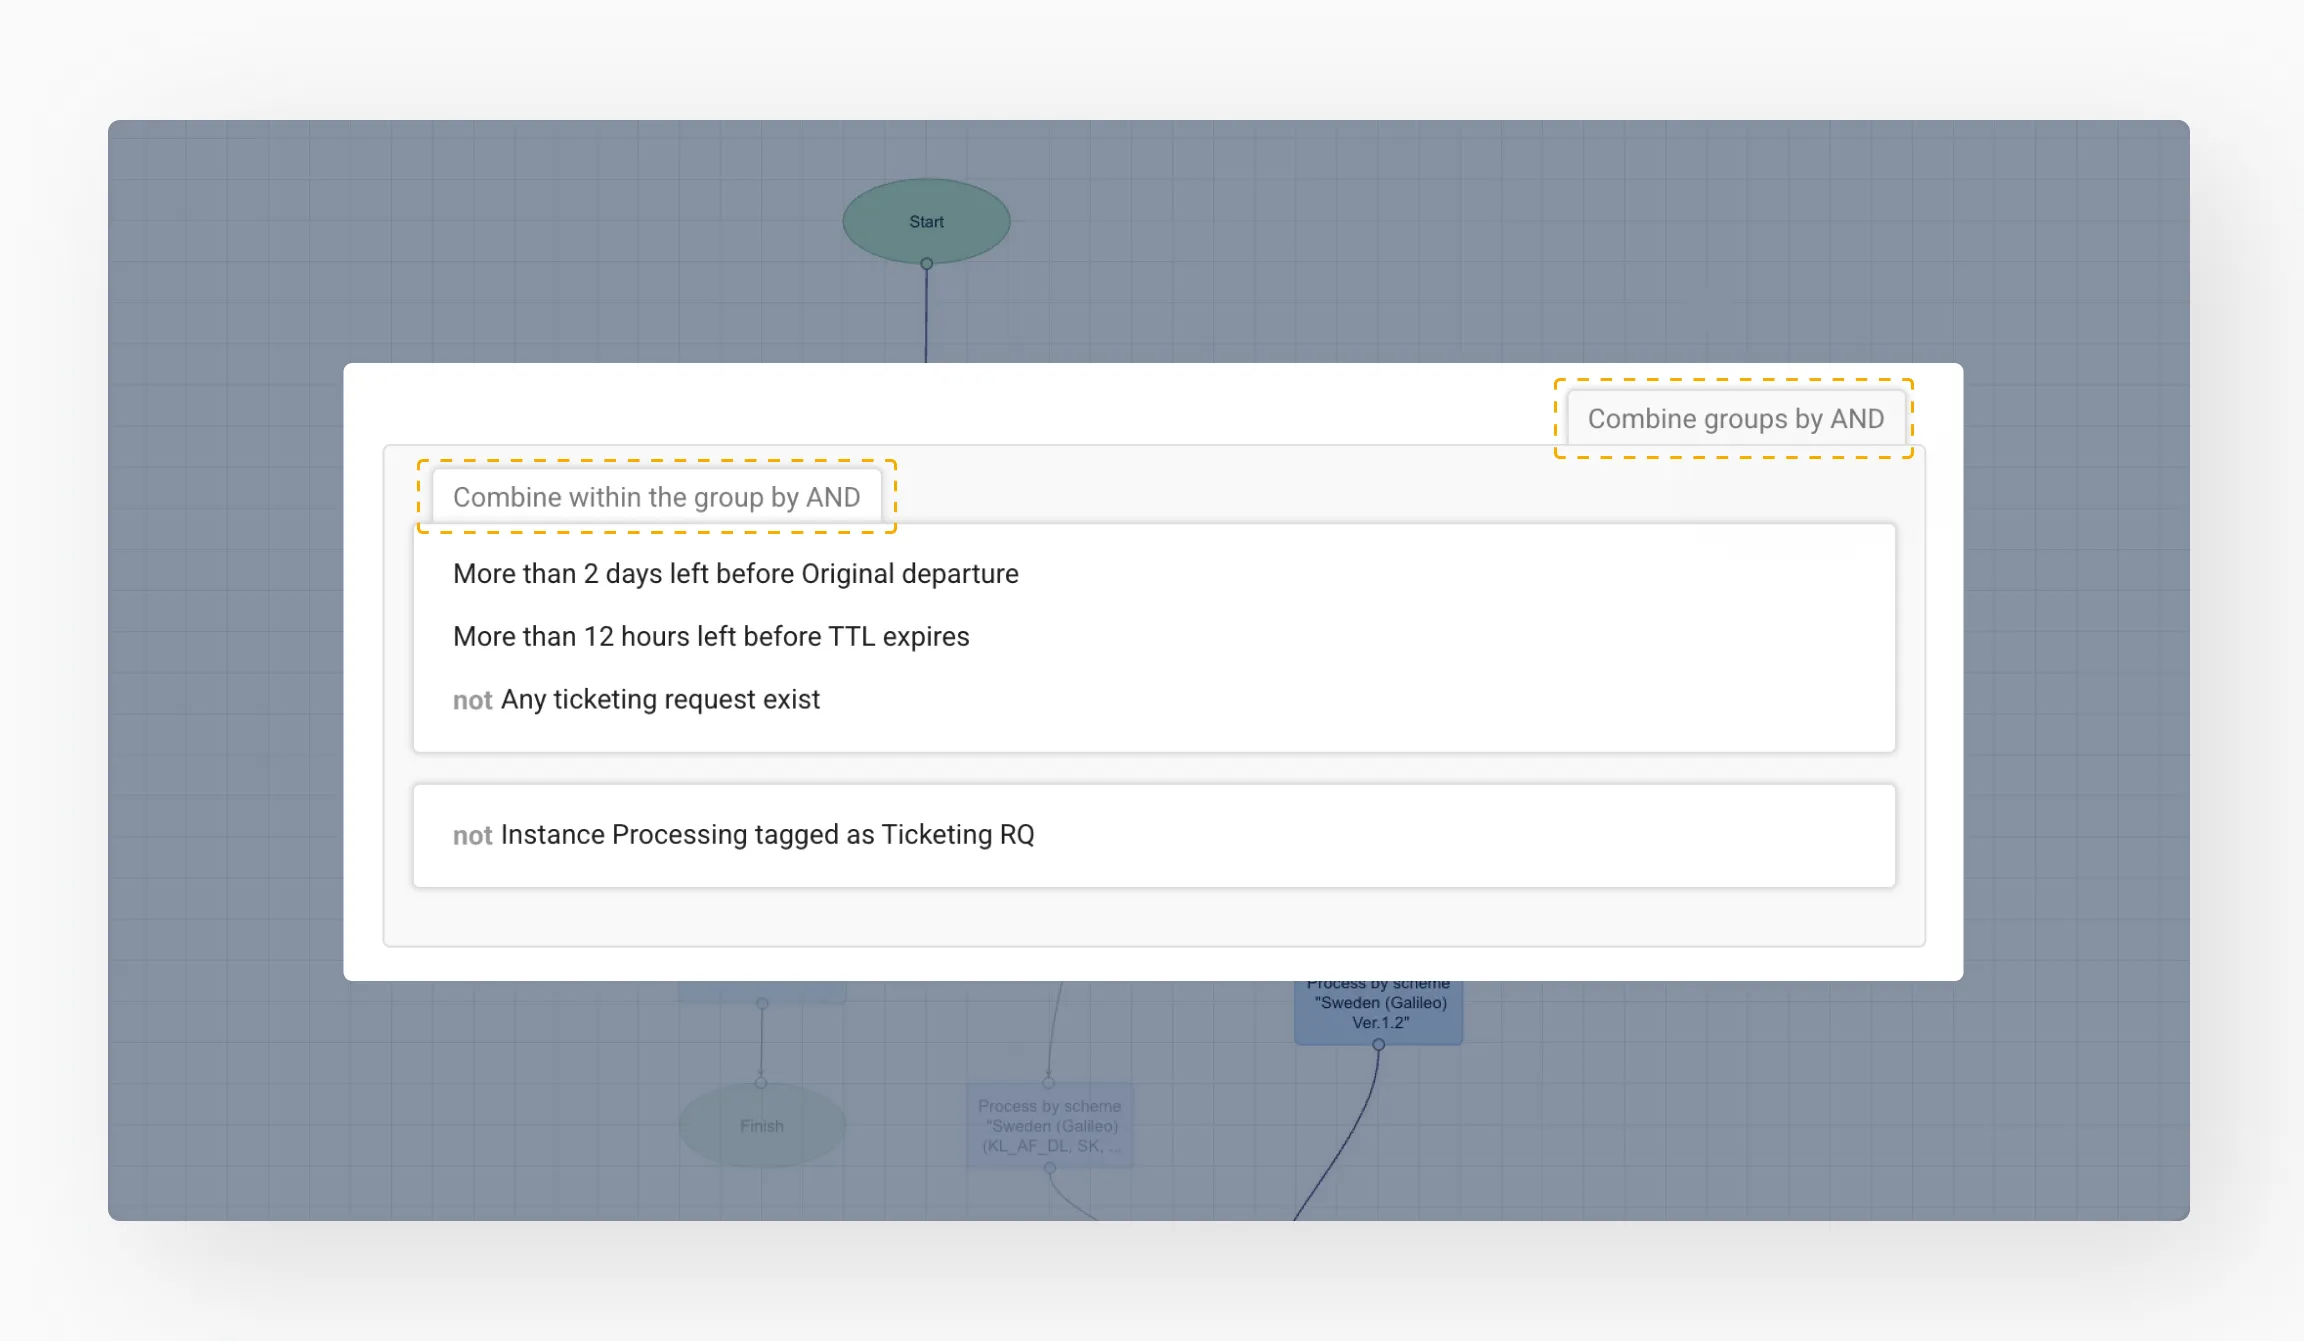
If any group fails, the remaining groups won't be evaluated – the history will show Not processing for those skipped groups.
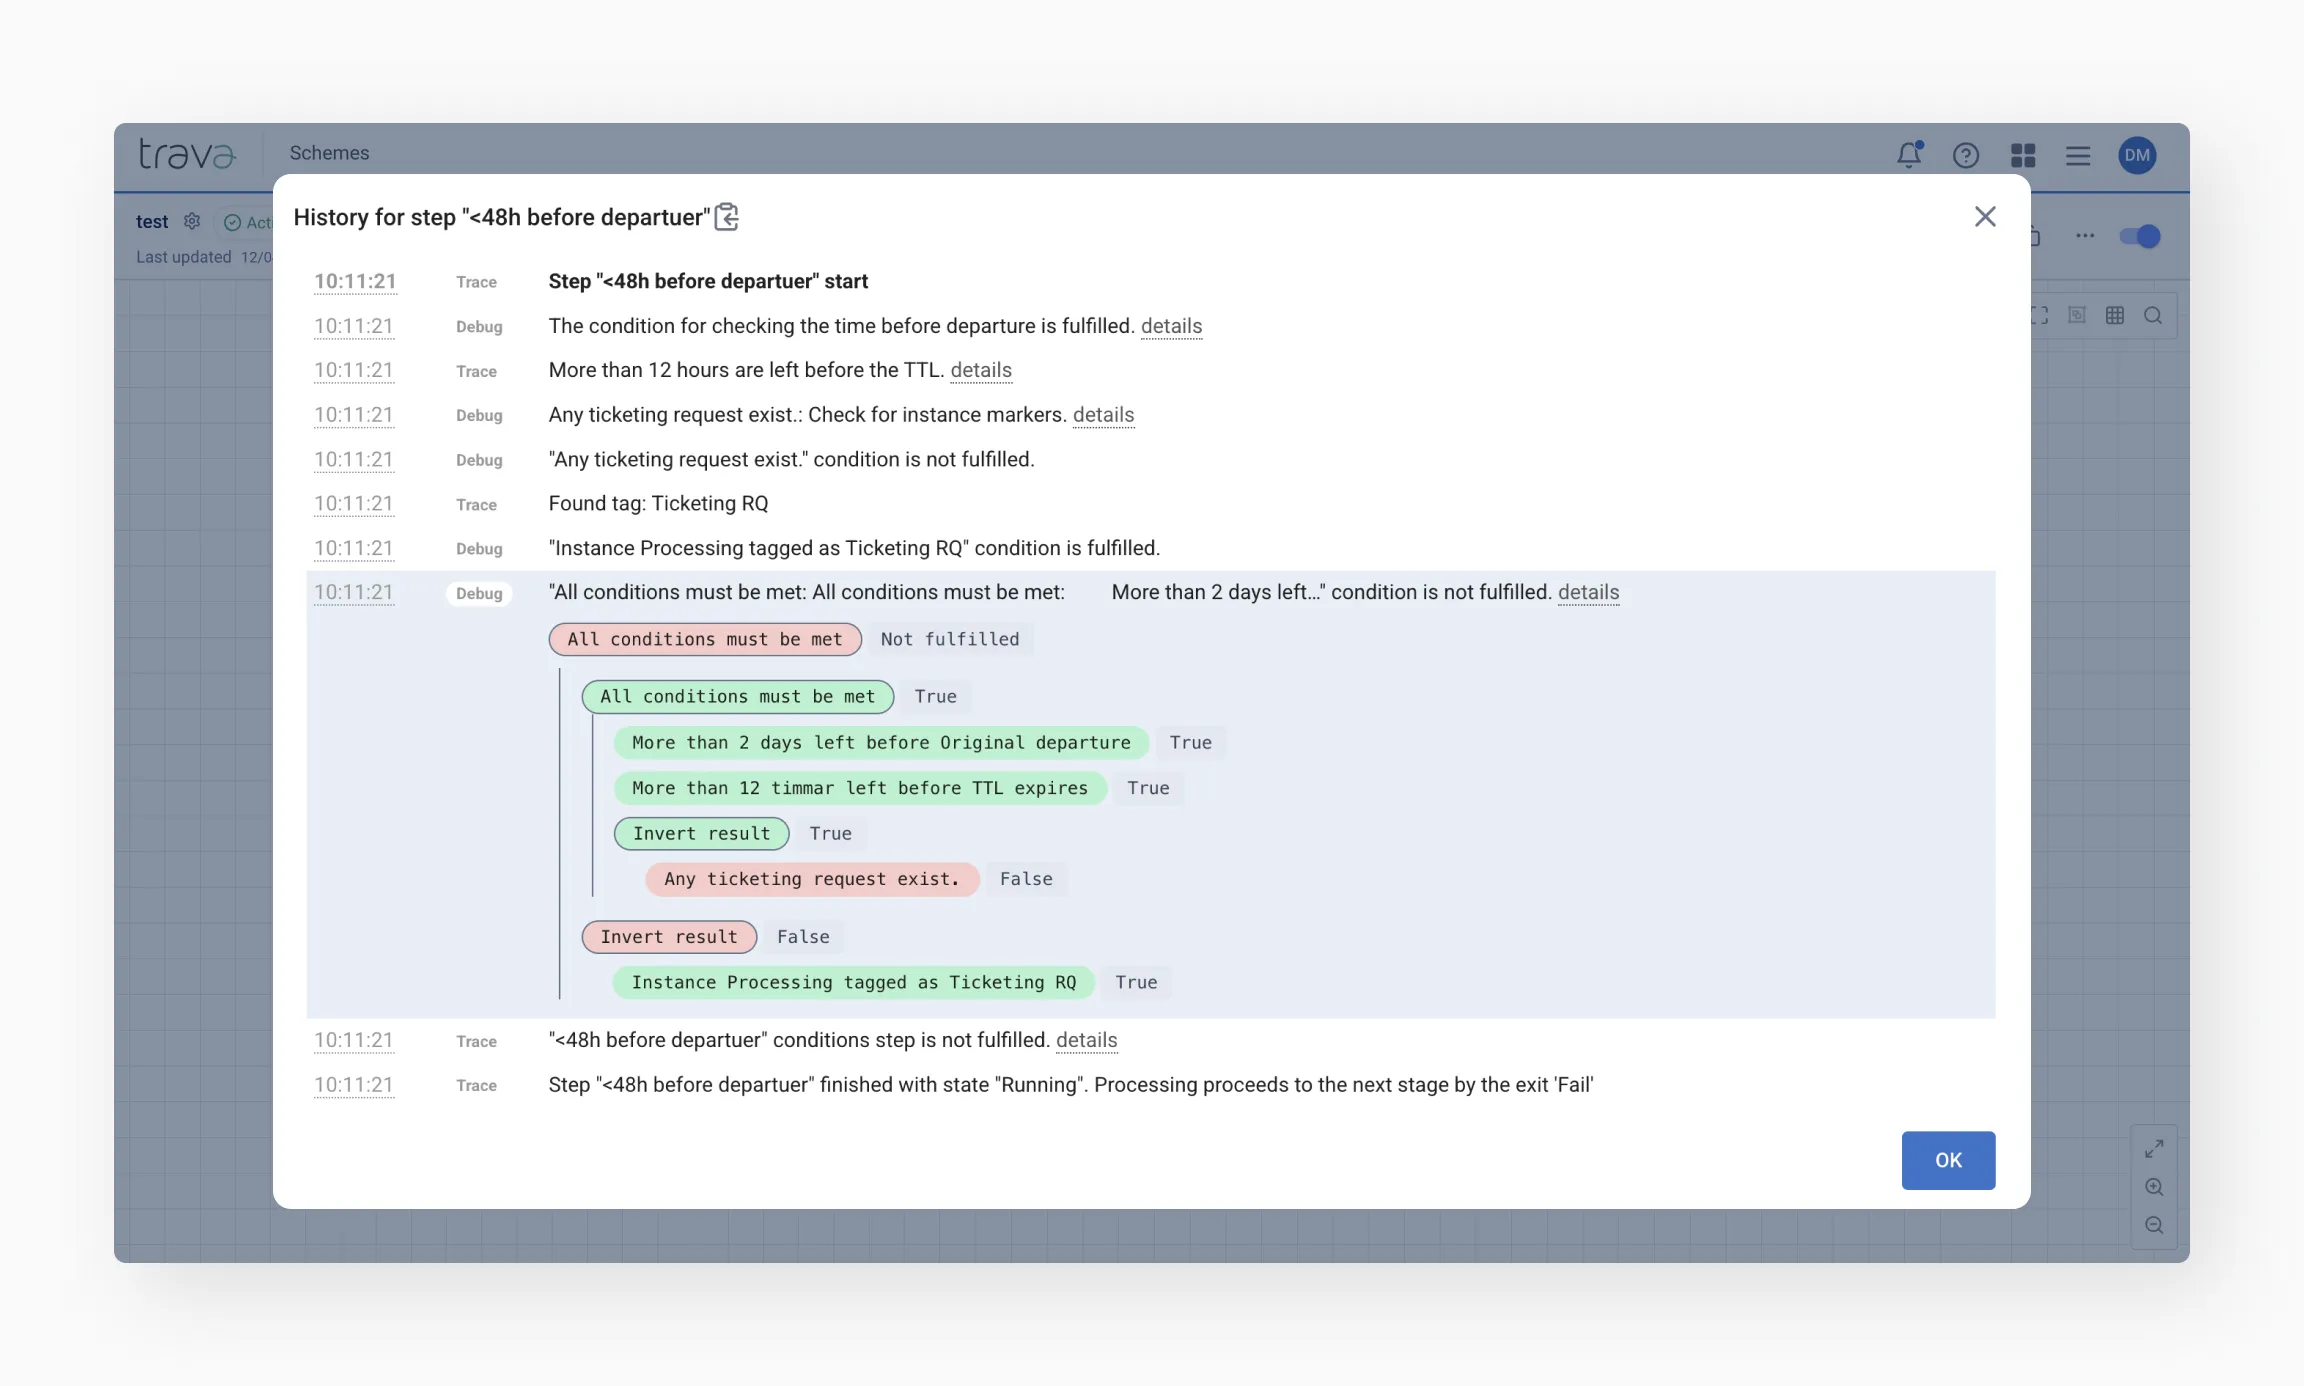
Keep this in mind when building complex conditions – group order and logic type (AND/OR) directly impact what gets processed.
Get support
In case you need support, copy the link and share it with our team – or create a case directly from the processing history view.
Final tips
- Use category levels wisely to get the right amount of detail for your task
- Check grouped conditions carefully: be mindful of order and logic (AND/OR) when checking complex rules
- Use icons for quick actions: jump to logs, see the scheme path, or get support directly from the history view
- Reviewing the processing history regularly helps catch issues early and keeps your workflow smooth