Processing history
The Document processing history view helps you see exactly what happened during each run – so you can investigate issues, validate system behavior, or just stay in control.
Why it matters
Processing history provides a log of all processes executed for a specific instance, enabling:
- Process optimization – review how conditions are evaluated and adjust step configuration to improve overall workflow performance
- Troubleshooting and debugging – identify which path a block followed and why, helping detect missing or misconfigured rules
How it works
A document can be processed by multiple schemes, each creating a separate instance. Within each instance, there may be several runs – either if this is defined by the scheme design or if the document needs to be reprocessed.
Since the data in the document may change between runs, the processing flow can differ even when using the same scheme.
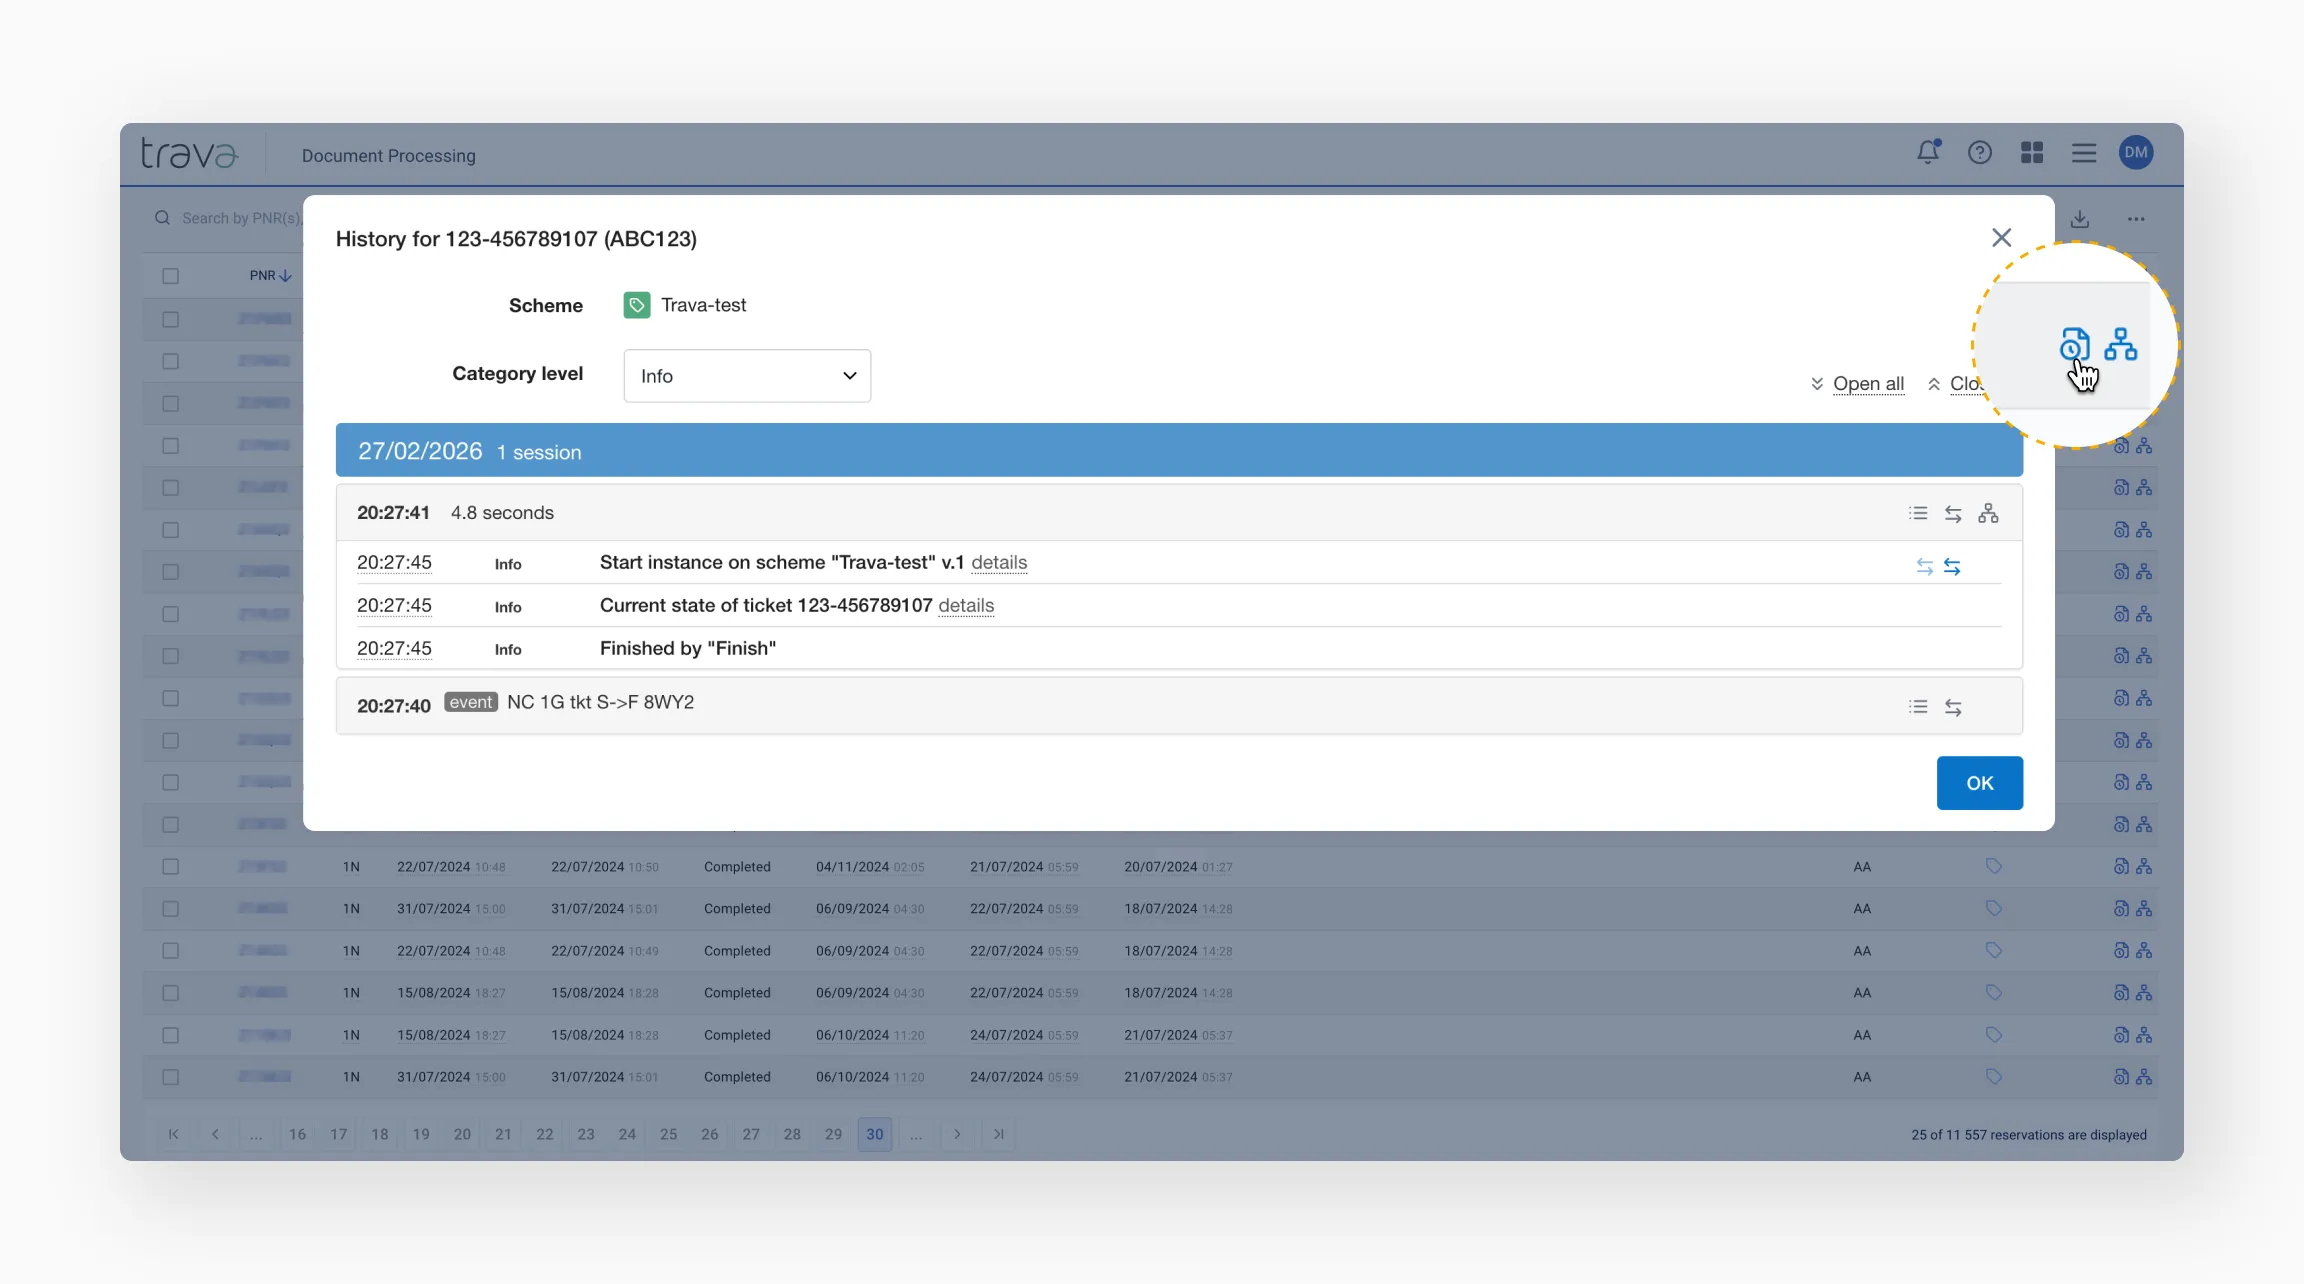
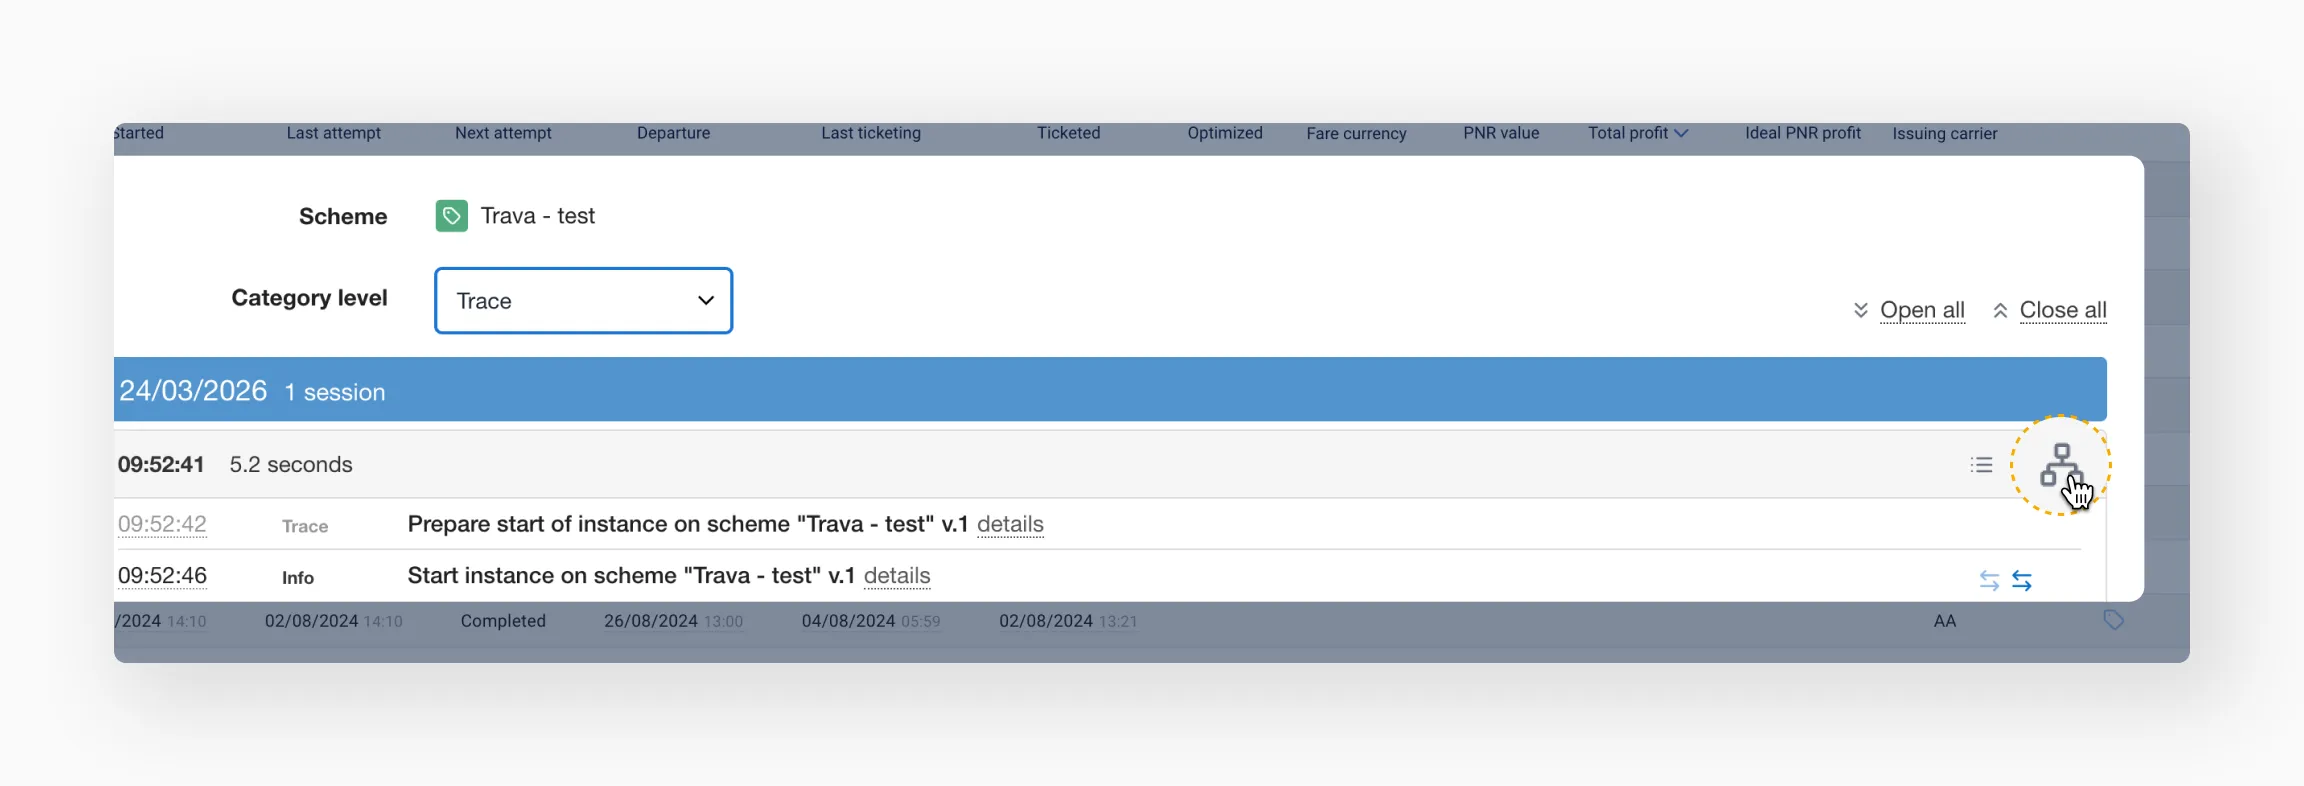
To open the processing history, click the icon at the end of the instance row in the Document Processing table.
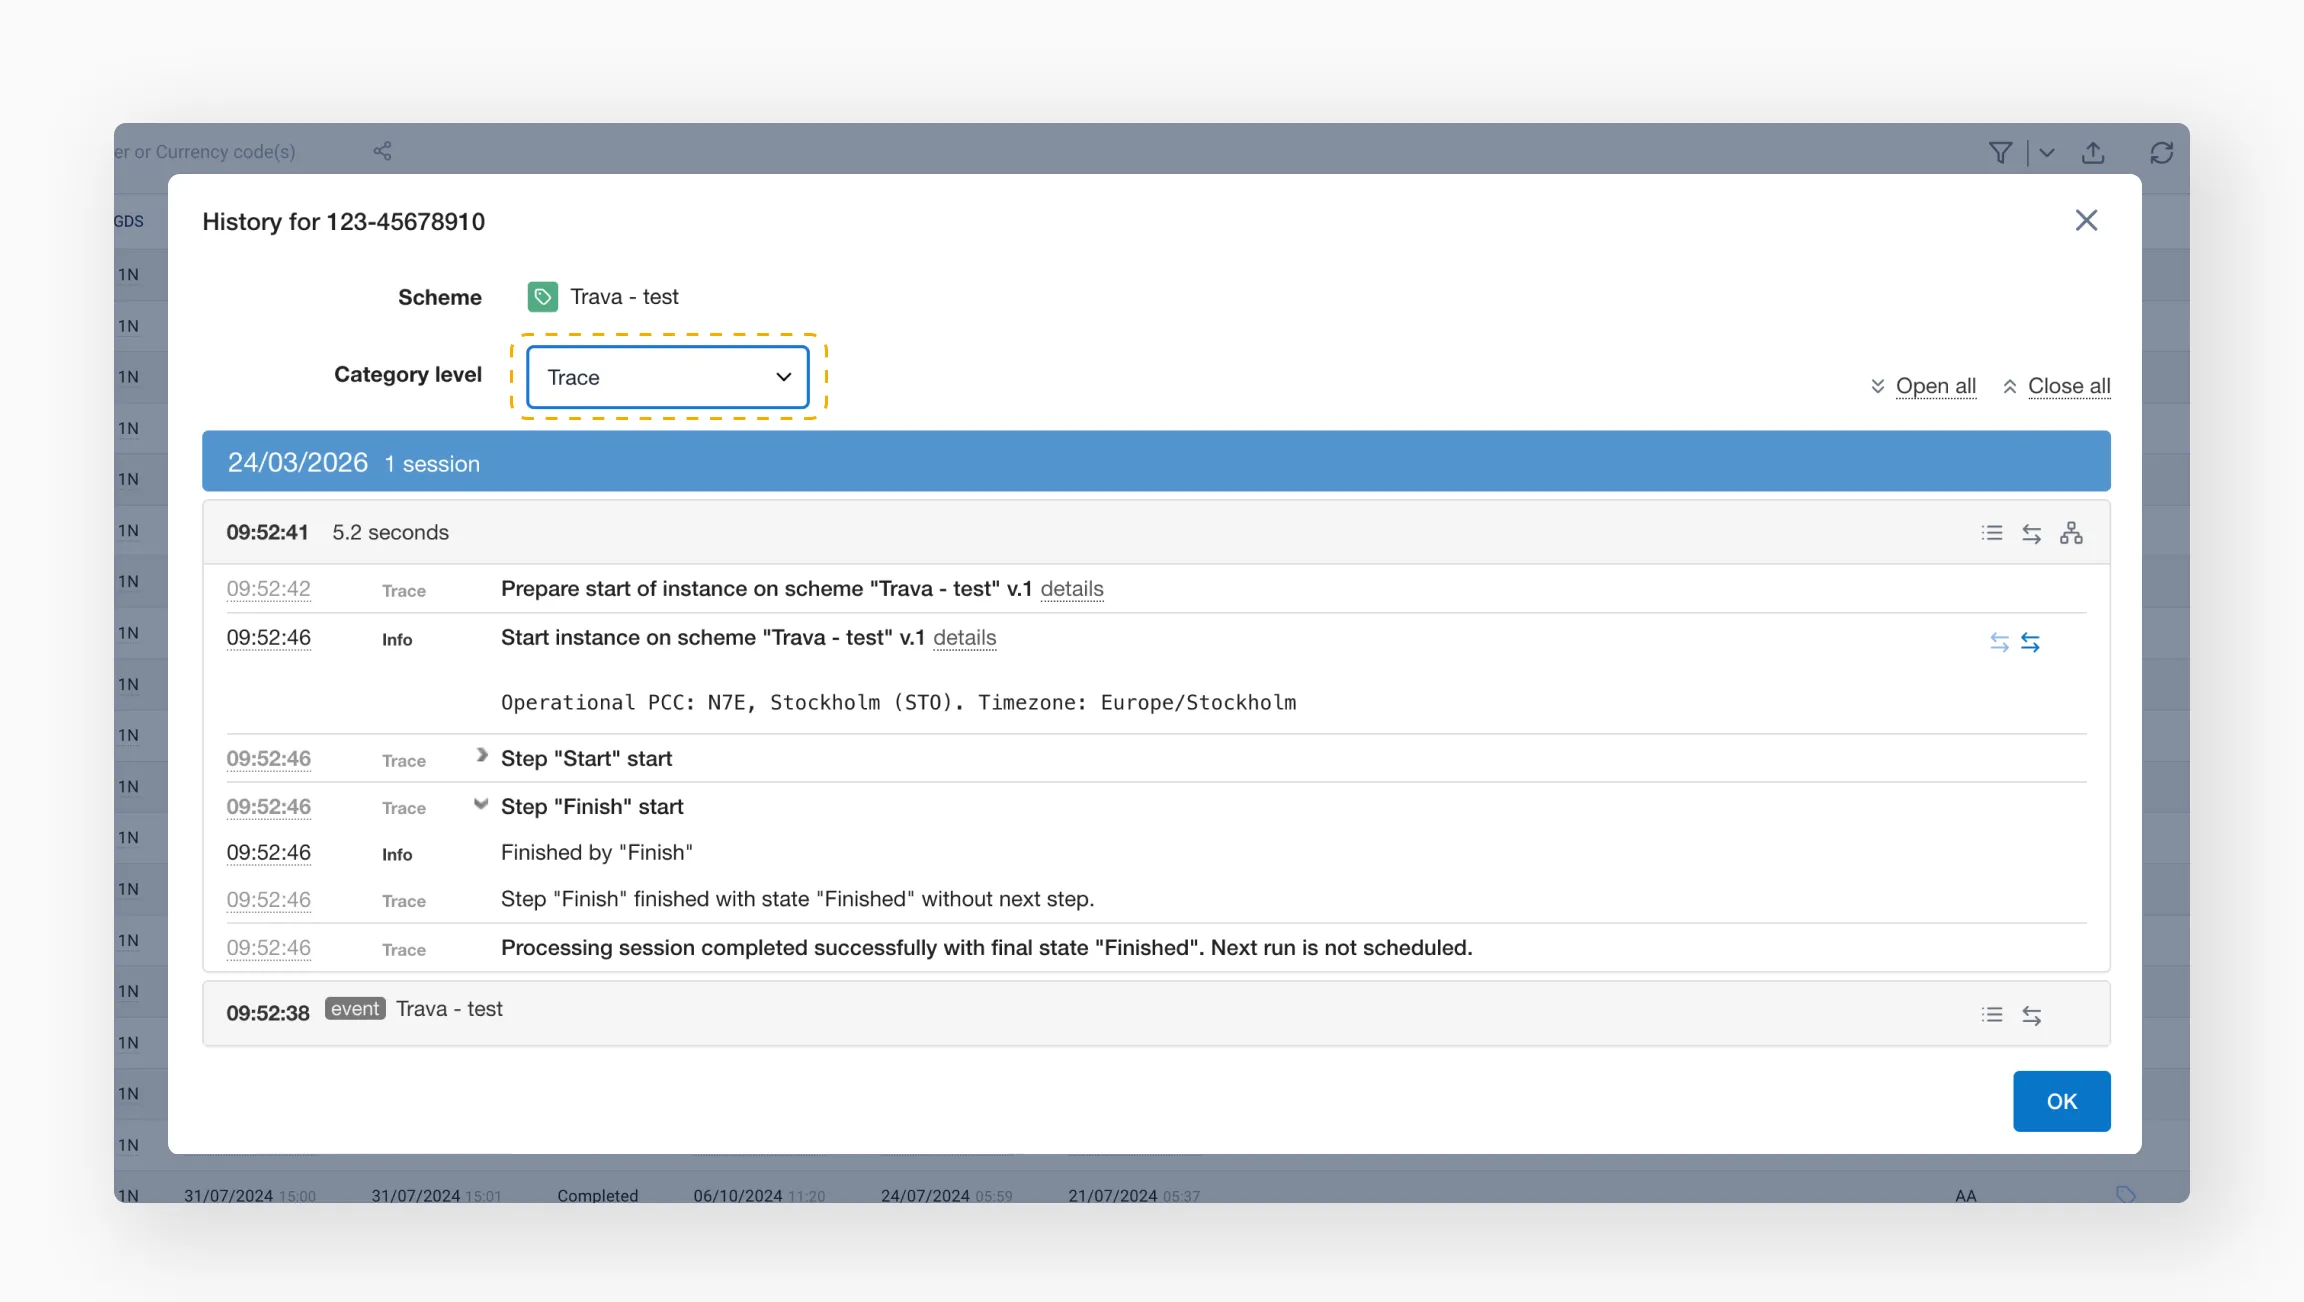
Understanding processing history
Sessions
Each run is saved as a session in the processing history. Sessions are displayed from bottom to top and grouped by date, making it easy to track the sequence of processing attempts over a long period.
A session records the state of the document at the time of processing. Click the gray field to expand the details.
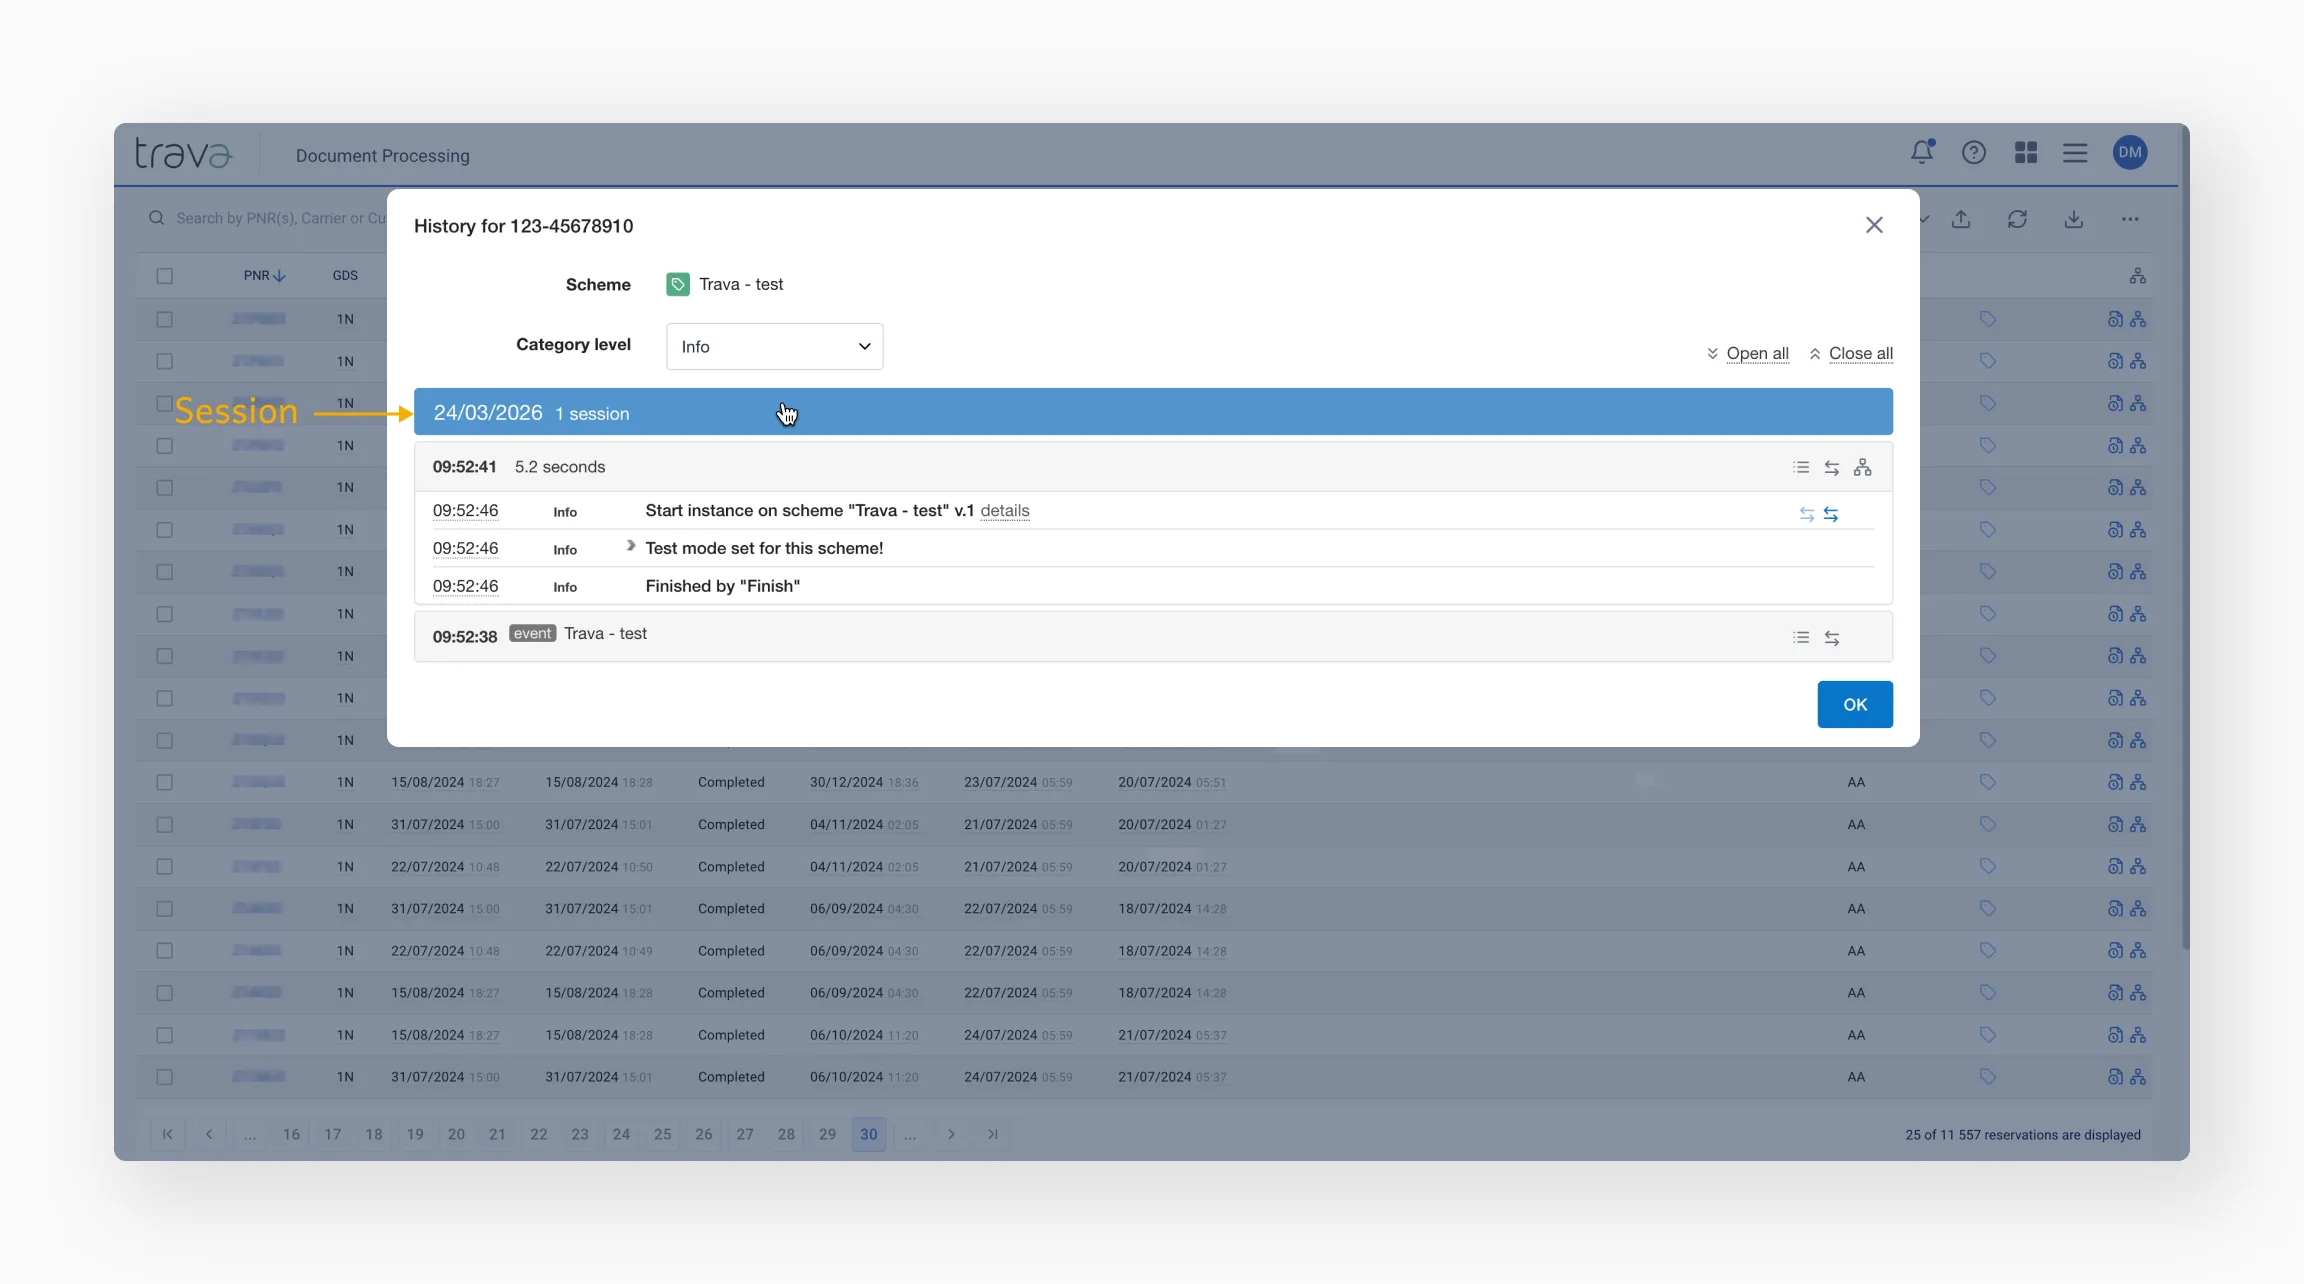
Sessions will continue as long as workflow conditions or project settings postpone processing. At the end of each session, you can see when the next run is scheduled. If no further runs are expected, the status will be Completed.
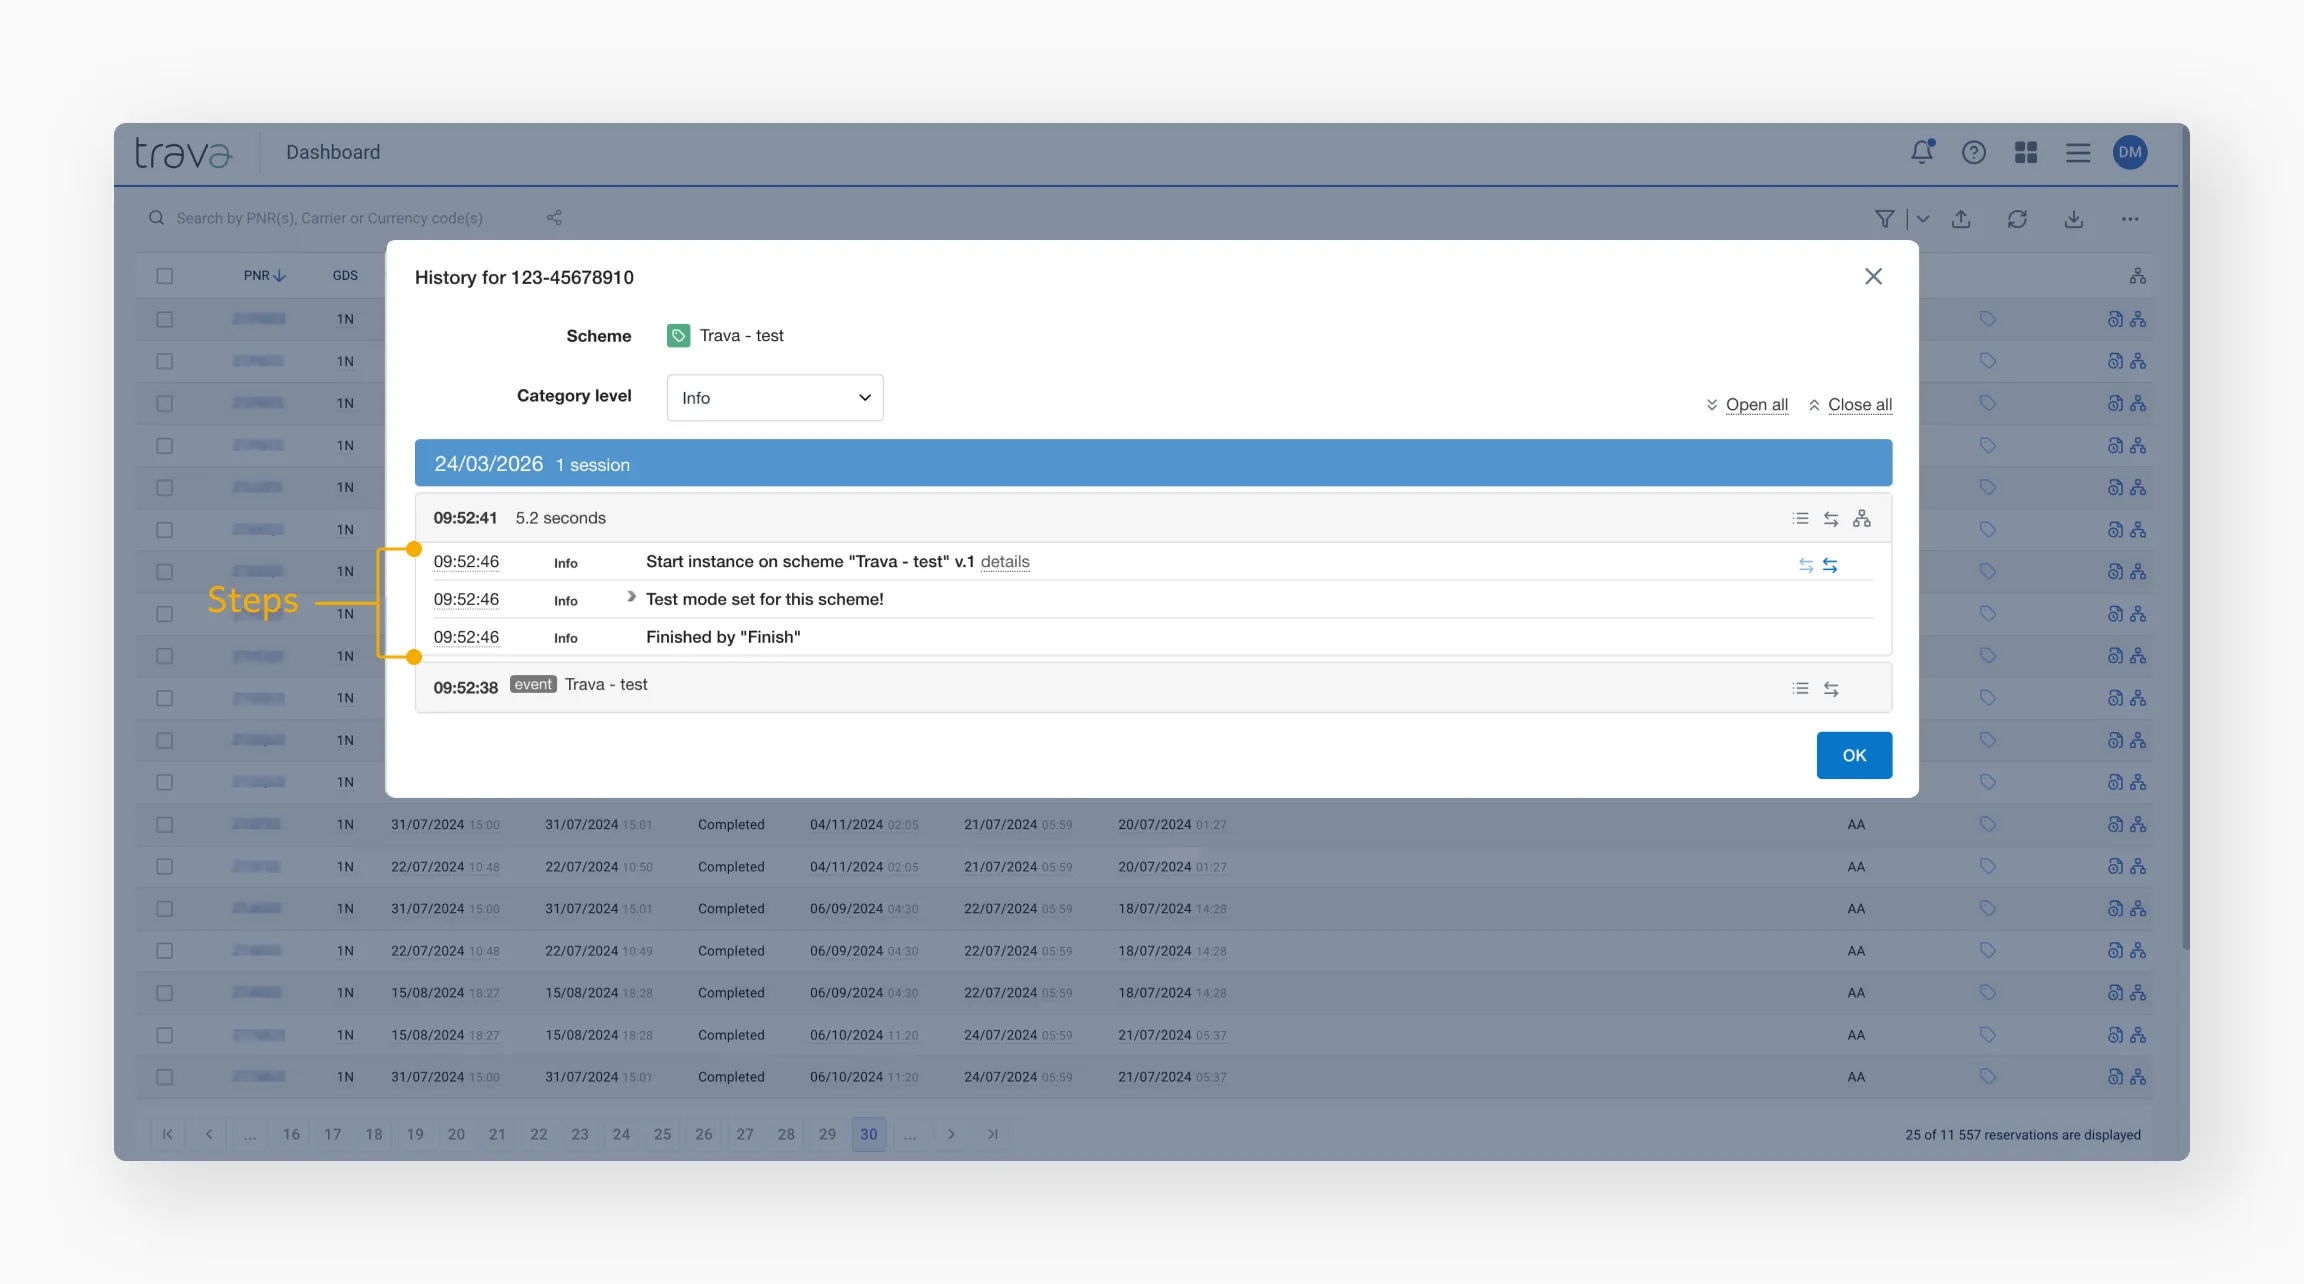
Steps
Sessions consist of steps. Each step contains detailed information on how the session was executed.
Category levels
For more detailed viewing, change the category level:
- Info (default) – shows only action blocks
- Trace – displays the full processing path, including condition evaluation
- Debug – provides additional technical information
- Fatal / Error / Warning – shows only steps containing warnings or errors
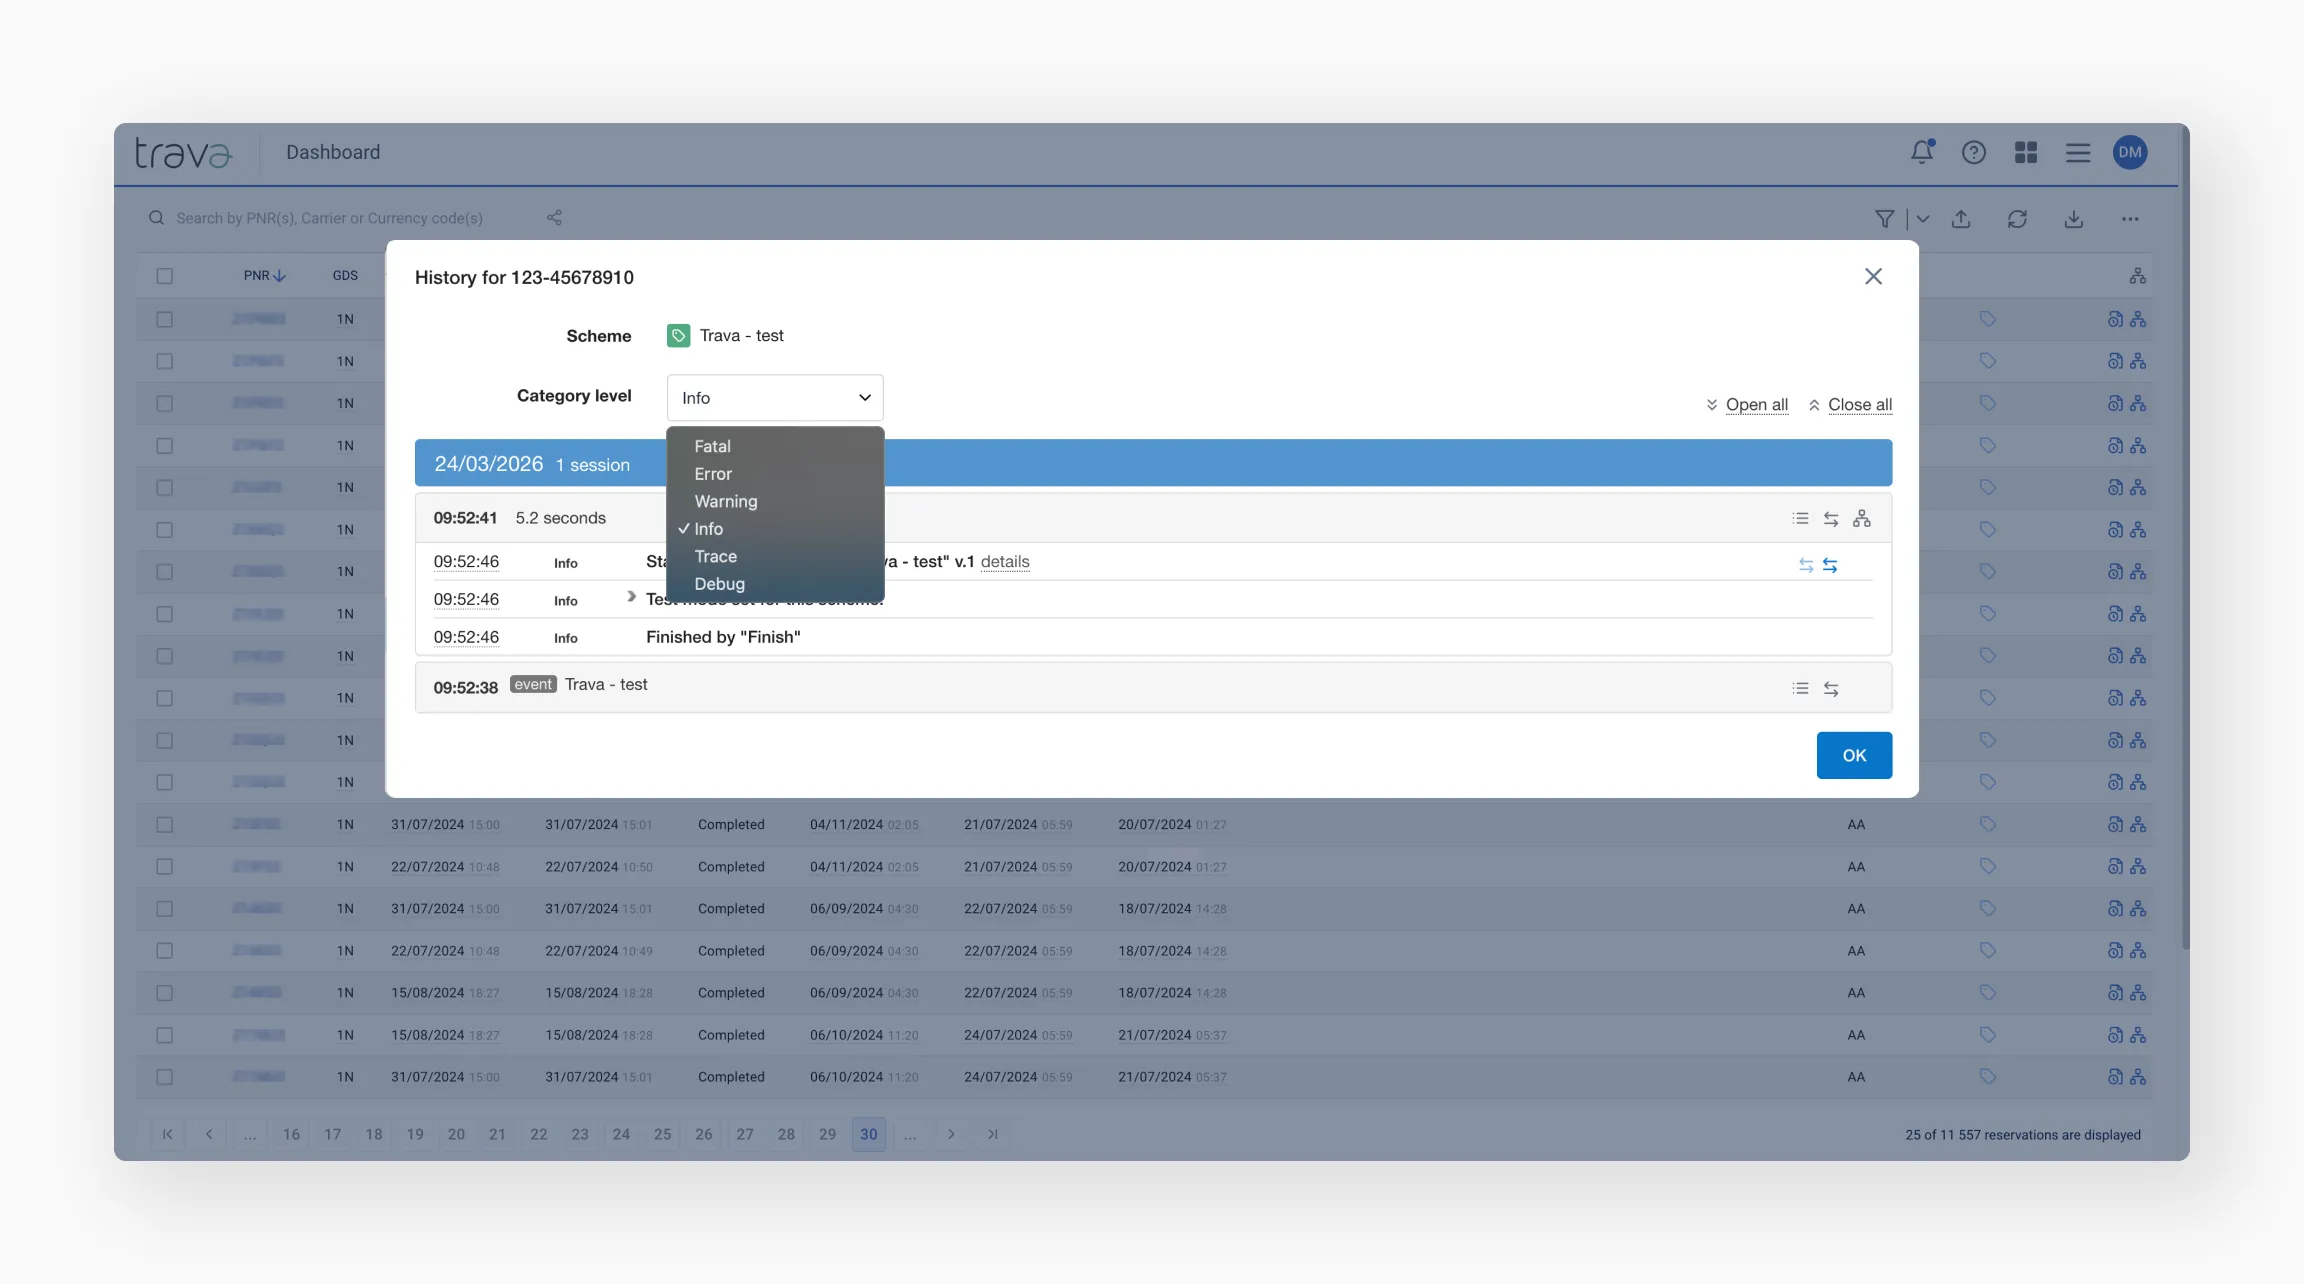
The Trace level displays the full processing path within the scheme – not only how each action was executed, but also how the system processed conditions.
Information icons
Icons on the right side of the session row indicate important events that occurred during processing:
- Tag assigned
- E-mail sent
- Error / Warning
[ADD IMAGE]
Hover over or click an icon to view details.
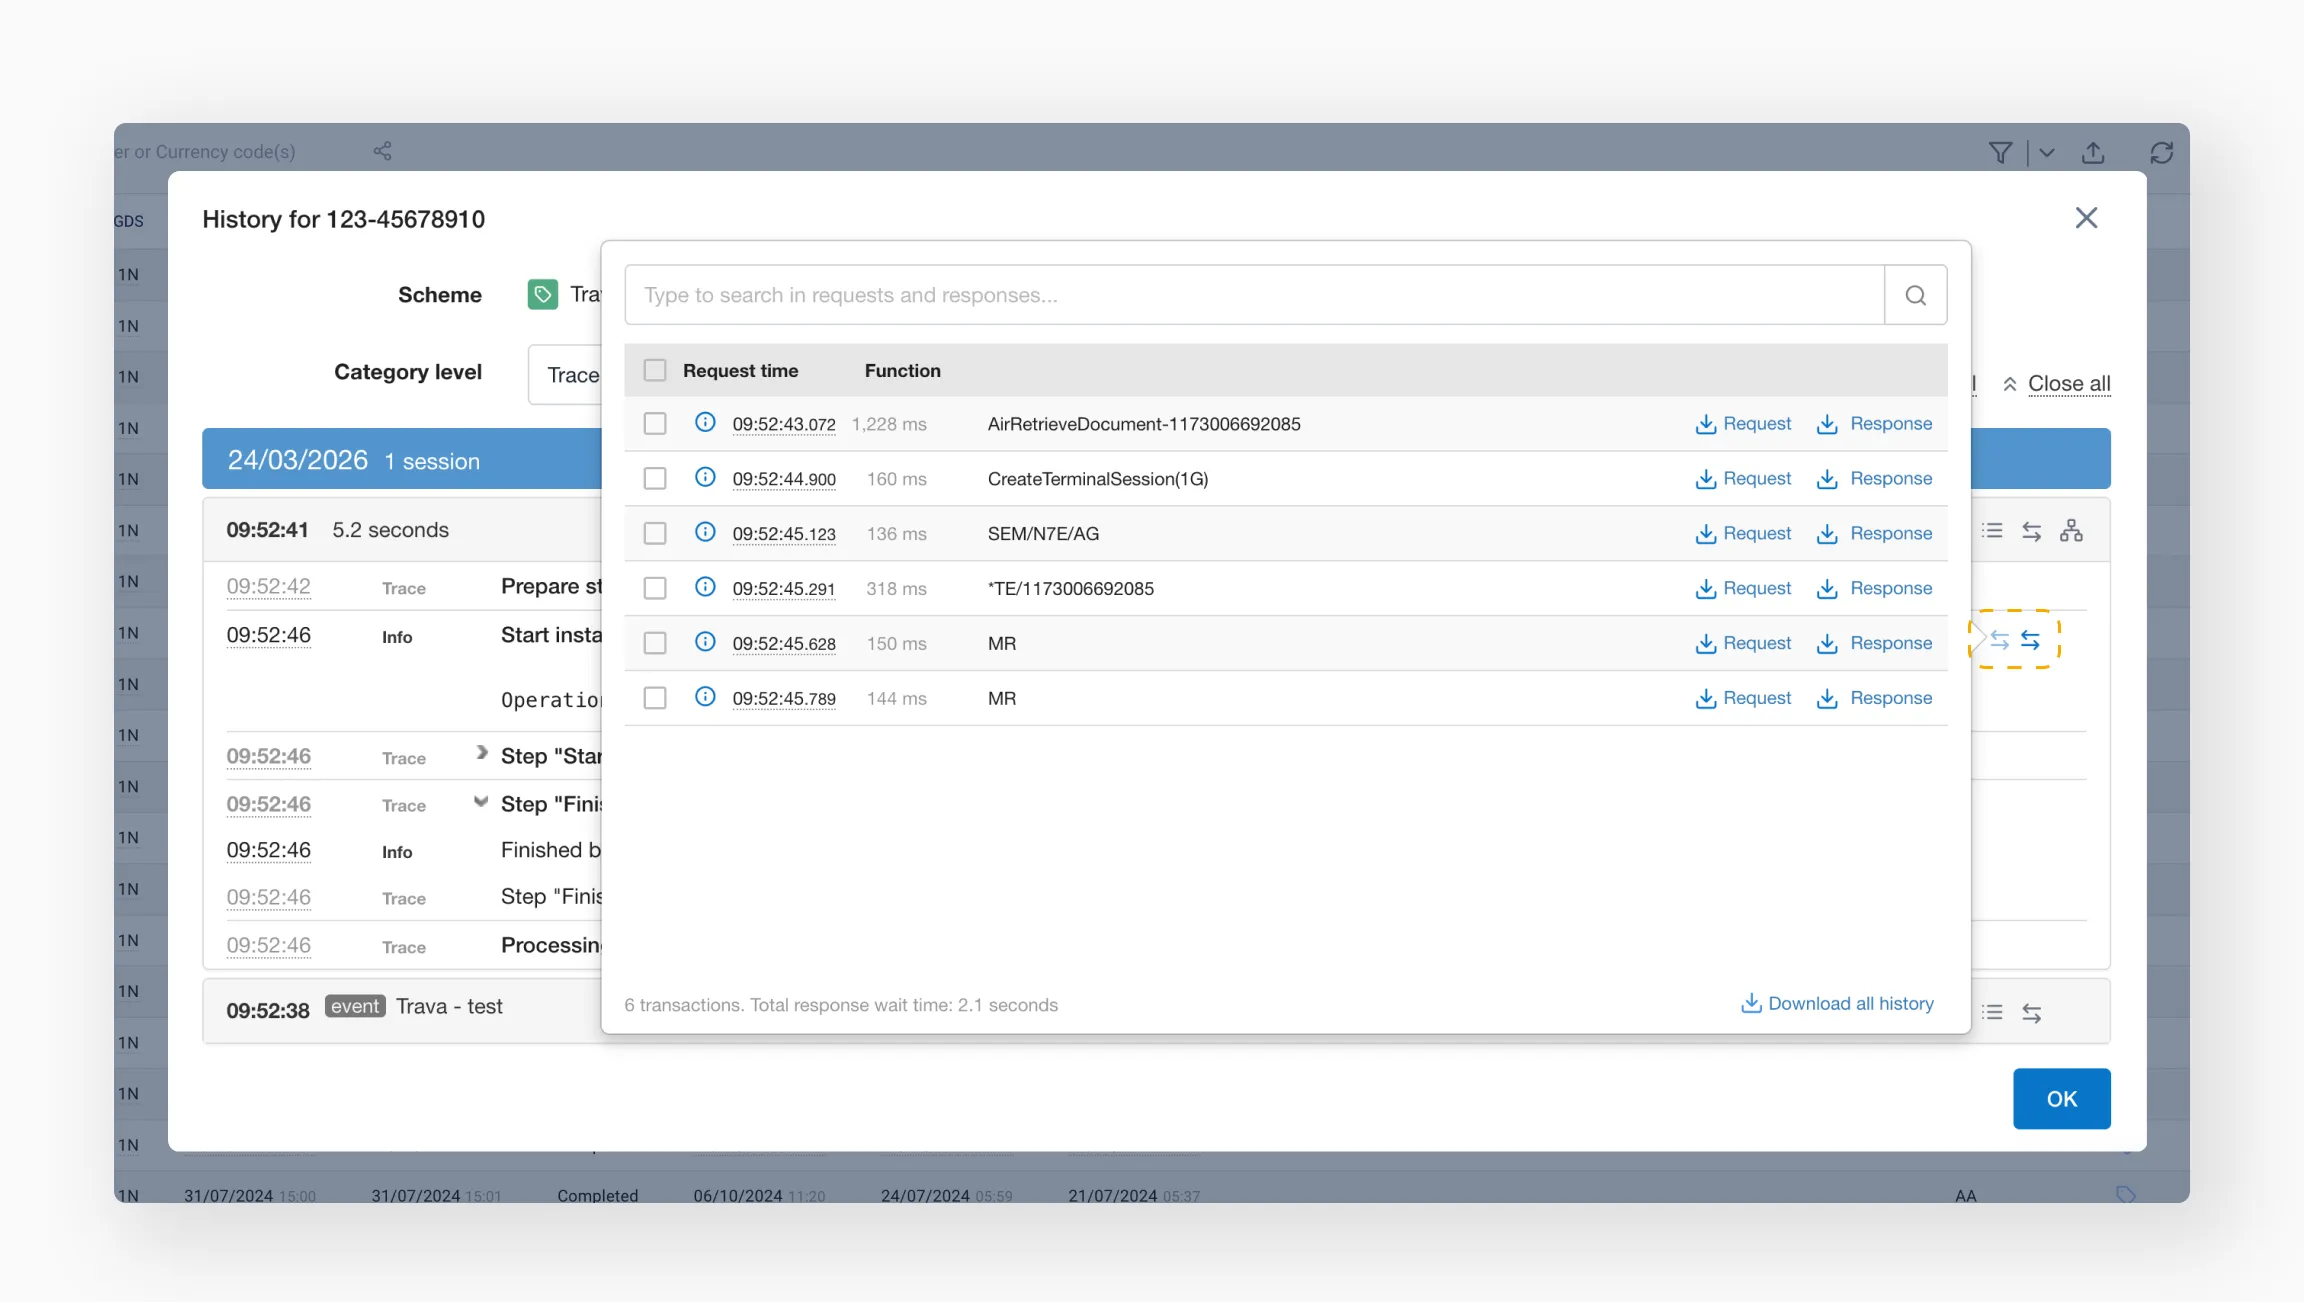
Actions
View web logs
Logs follow a request–response format and show which data was requested, how it was requested, and what responses were received.
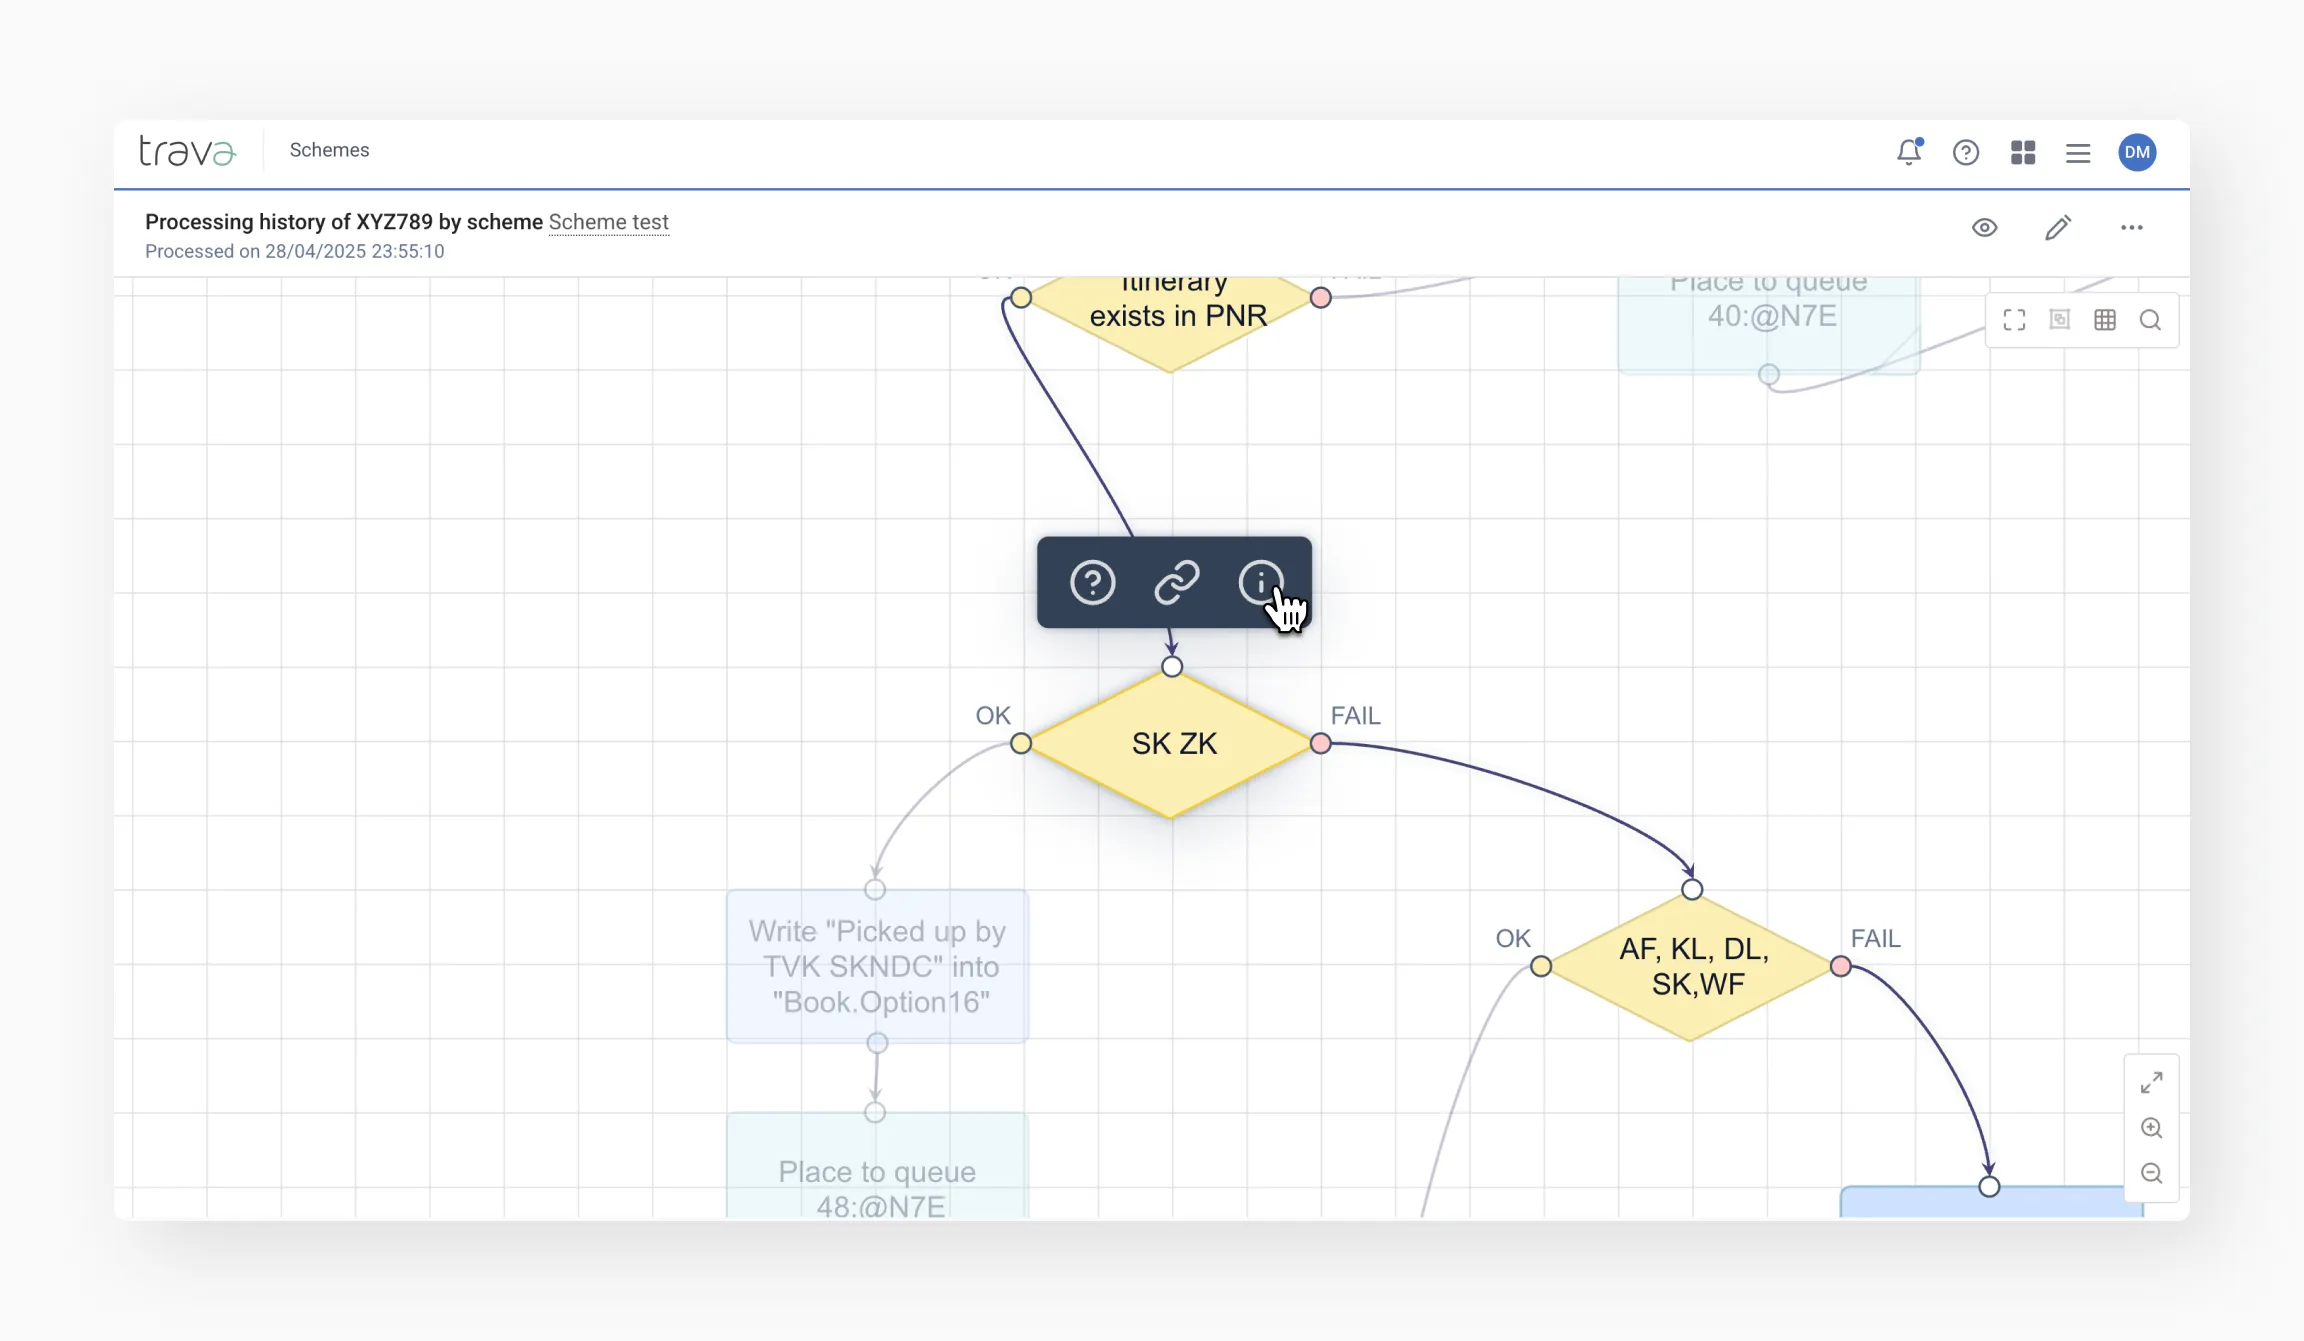
View scheme path
A scheme opened from the processing history highlights only the steps that were actually executed during that processing run.
The scheme displays a Processing history label in the top-left corner, along with the document number, scheme name, and date and time of processing. Hover over or double-click an element to see its configuration.
A single click on an element opens an additional menu:
- Question mark – quickly create a support ticket with a link to this step
- Link – copy link to the element
- Info icon (i) – view detailed processing information, including which checks were performed
From here, you can edit your scheme or view its current version.
Get support
If you need support, hover over the row of the processing session to display a question mark icon. Clicking this icon opens a form you can fill out to contact our support team.